| |

How to Format Chart or Chart DataWhen you select the chart three new tabs Design, Layout and Format appear in the Ribbon. Each tab contains specific groups of chart tools to format charts and chart data. The Design tab contains four groups; Type, Data, Chart Layouts and Chart Styles. See the image: 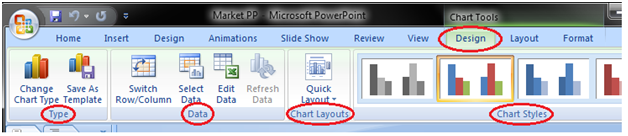
The Layout tab contains six groups; Current Selection, Insert, Labels, Axes, Background and Analysis. See the image: 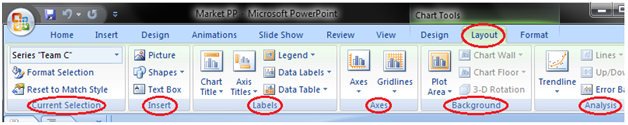
The Format tab contains five groups; Current Selection, Shape Styles, WordArt Styles, Arrange and Size. See the image: 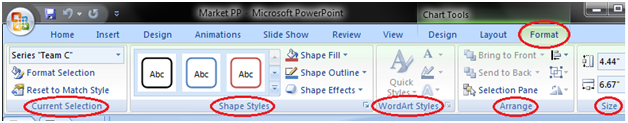
Next TopicHow to Apply Animation Effect
|
 For Videos Join Our Youtube Channel: Join Now
Feedback
- Send your Feedback to [email protected]
Help Others, Please Share


Like/Subscribe us for latest updates or newsletter 


