| |

Add charts in Laravel using Chart JSIn this section, we are going to learn about add charts by using the chart JS. We will use Laravel to do this. The blade template engine of Laravel is incredible. In Laravel view, JS, a library of JS, and a variable of PHP can be easily used. In our Laravel application, we will use the Chart.js library to create the charts. Area charts, bar charts, column charts, line charts, etc., can be used by the Chart.js library. We can use more charts by using the several graph and theme which is also provided by this library. The below example will be useful for us when we want to add charts on the server-side of Laravel. We will use our database to fetch the data, and after that, we will set that data in the Chart JS function. In our below example, we will use chart JS to create the bar chart. We will use that bar chart in our Laravel application. The process to add charts in Laravel is described as follows. Firstly we will use our routes.php file to add the chartjs route. app/Http/routes.php After that, we will use Homecontroller to add the following methods. HomeController Method Now we will use our chartjs view file to add the below code into that file like this: chartjs.blade.php Now our above code is ready, and we can run it. When we run this, the following output will be generated: 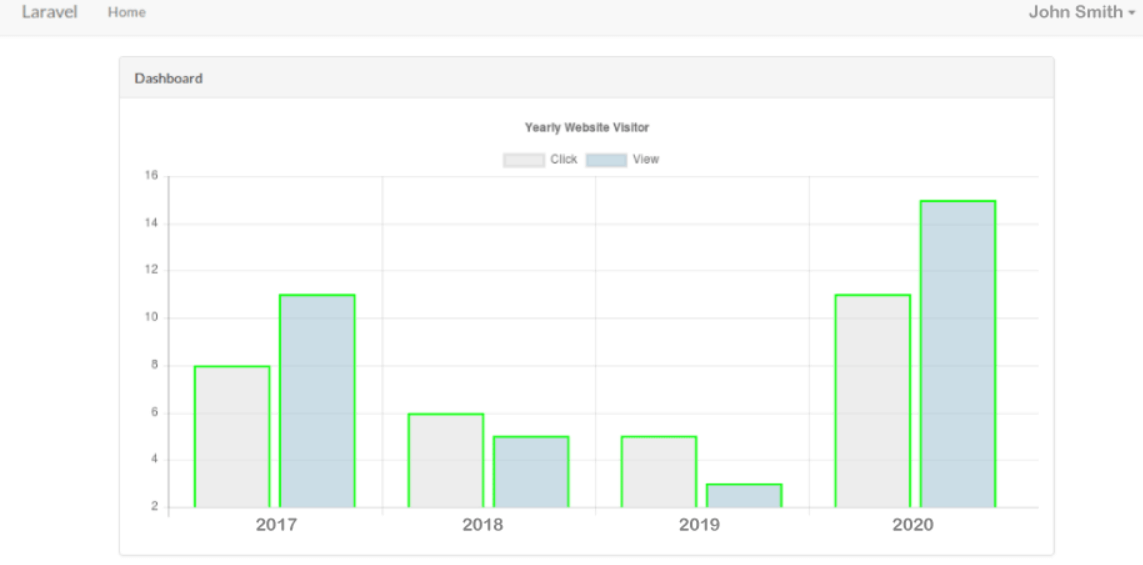
Next TopicMongoDB CRUD in Laravel
|
 For Videos Join Our Youtube Channel: Join Now
Feedback
- Send your Feedback to [email protected]
Help Others, Please Share


