| |

Advantages and Disadvantages of HistogramDefinition of the Histogram:Assume that in the manufacturing sector, we have several challenges in determining whether our production is meeting a certain target and that, in such circumstances, it proves to be worthy enough. It may be a helpful tool for troubleshooting. To comprehend the data that reoccur more frequently and examine the data density in any given distribution. Utilizing this, we may contrast various equipment, operators, sellers, etc. The histogram, which Karl Pearson invented, displays the probability distribution of continuous data. 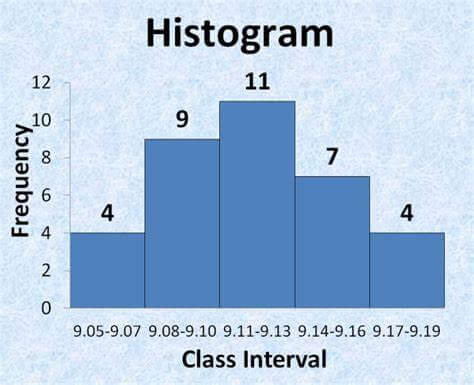
A frequency distribution displays the frequency at which each unique value in a data set occurs. The most popular type of graph to depict frequency distributions is a histogram. There are notable differences even though it has many characteristics with a bar chart. One of the seven essential quality tools is this helpful tool for compiling and analyzing data. A histogram, a visual representation, uses bars to display the data value to display the frequency of data items in a series of equal-sized numerical intervals. The X and Y axes display the interval sizes and frequencies, respectively. Each bar's height indicates the frequency of each interval size. It presents data in a way that makes it simpler to identify a process's dispersion and central tendency. The histogram allows us to look at the distribution and shape of the data. When the sample size is greater than 50, it is most effective. A quality inspector, for instance, would inquire about the volume of sheets produced within a given range of thicknesses in the steel manufacturing industry. It may also be used to determine whether the process is producing steel sheets within the required range or not. Furthermore, depending on the range, it may be less or more. 
Similarly, a quality inspector in a pharmaceutical company seeks to determine whether or not bottle caps are properly secured. It is crucial to examine the bottles since if they are tied carelessly or firmly, they could leak out or be difficult to open. Here, he can choose a sample of bottles and specify the torque value necessary to open a cap; let's assume it is 20. To see the visual depiction, plot the data in a histogram. Bar charts and histograms are extremely comparable. This graph combines a line chart and a vertical bar graph. Rectangles of equal sizes are used to display the data in this case. The distribution of data or information over a continuous period is shown using a histogram. The frequency of the variable is related to the area of the rectangular bars. Although histograms and bar charts may resemble one another, histograms are intended to depict continuous data, while bar charts display the frequency of variable occurrences. Bins are used to categorizing this continuous data. Using these containers, the majority and minority points can be quickly identified. Additionally, when drawing a histogram, care should be taken to avoid making the bins either too thin, which could affect the flow of the frequency distribution, or too thick, which would make it difficult to see changes in the data. 
A frequency distribution with continuous classes arranged graphically is called a histogram. It is an area diagram, which can be characterized as a set of rectangles with bases representing the separations between class boundaries and areas that are proportional to the frequencies in the associated classes. Due to the base's coverage of the spaces between class boundaries, all rectangles in such representations are adjacent. Rectangle heights are inversely correlated with corresponding frequencies for similar classes and inversely correlated with frequency densities for different classes. Histogram Types:Depending on how the data are distributed in frequency, the histogram can be divided into many categories. There are many different distributions, such as the normal distribution, the skewed distribution, the bimodal distribution, the multimodal distribution, the comb distribution, the edge peak distribution, the dog food distribution, and the heart cut distribution. All of these various distributional types can be represented using the histogram. A histogram can be one of several sorts, including:
Advantages of HistogramHistograms are primarily useful because they are straightforward and adaptable. It provides an insightful look at frequency distribution and can be applied in various contexts. For instance, it can be applied in sales and marketing to create the most successful pricing strategies and marketing campaigns. 
Disadvantages of HistogramThe drawbacks of a histogram include their great focus on the quantity of "bins," or lines, and their strong sensitivity to the maximum and lowest of the variable. 
A graph's appearance might change drastically when the max and min are changed, which can be deceptive. Additionally, their simplicity makes it challenging to understand the data's implications and distribution.
The ConclusionA histogram can be made to display a data set or data distribution visually. The data values' frequency and significant data volume are displayed in histograms. As a result, the histogram aids in locating the median and distribution of the dataset. This can show any gaps or outliers in the data set as well. |
 For Videos Join Our Youtube Channel: Join Now
Feedback
- Send your Feedback to [email protected]
Help Others, Please Share


