| |

Advantages and Disadvantages of MedianDefinition of Median:The median is the value separating the higher half from the lower half of a data sample, a population, or a probability distribution in statistics and probability theory. It can be regarded as "the middle" value for a data set. The fundamental difference between the mean (commonly referred to as the "average") and the median in expressing data is that the median more accurately depicts a "typical" value since it is not distorted by a tiny percentage of exceptionally big or small values. Because the distribution of income can be rather skewed, the median income, for instance, might be a better indicator of what a "normal" income is. Given that it has a breakdown threshold of 50% and is the most robust statistic, the median is essential to robust statistics since it prevents results from being arbitrarily large or small as long as no more than half the data are polluted. 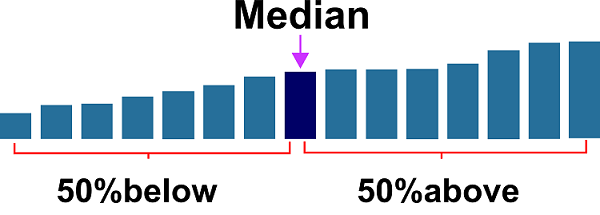
Everyone should be familiar with the words average and median, regardless of whether they are enrolled in an introductory statistics course. Although these phrases are frequently used interchangeably, they are different when considering your data set, particularly when it comes to corporate usage and scientific research data sets. A median is any number in the middle when all numbers are lined up from smallest to largest, with half of those above and below it. An average is the sum of all numbers divided by the total number in the collection. A particular kind of average that can be used to depict values in data sets is the median. How median values are calculated is by finding the point where half of your data is below and half is above. Although it is less frequently used than an average, it is especially helpful when your dataset contains outliers that could skew the mean calculation or standard deviation. Given that it is the halfway point in your dataset, the median has some statistical advantages over averages and means, which is why it is called the median. The median value condenses distributional data in summary statistics and data visualization. This contains graphics like scatter plots, histograms, stemplots, boxplots, and more. Median values are presented in these kinds of visualizations in their precise center or areas with an odd number of data points. Take a mean average if your data set contains an even number of data points. Advantages of Median:It makes it reasonable to discuss what the median is to start with. The median identifies the value in the middle of a group of numbers with the same number of values below and above it. As an illustration, the value 3 in the range [1, 4, 3] is the median because there are two values smaller than 3 (1 and 2) and two values bigger than 3 ([1, 4]). (4 and 5). Given that it is a statistical measure, the median has many advantages over other averages, including the following:
Contrary to other averages, the median does not require challenging or intricate calculations. For instance, establishing an average while working with data containing decimals is more difficult than it should be, but figuring out a median is simple. Additionally, since it just uses whole numbers, determining the median value doesn't require complicated steps and can be done quickly.
Extreme values have no impact on the median. This implies that a given extremely high or low value won't affect your average. As an illustration, the value 3 in the range [1, 4, 3] is the median because there are two values smaller than 3 (1 and 2) and two values bigger than 3 ([1, 4]). (4 and 5). Since there are only three numbers in our set and four is an extreme value, we may claim that number four is not a part of our set in any way. 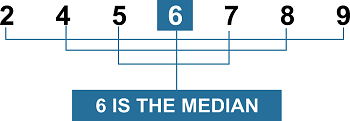
By just drawing a line between your data points, you can see how simple it is to determine exactly where your median lies. A line that splits a group of data points into two halves visually represents the median. As an illustration, the value 3 in the range [1, 4, 3] is the median because there are two values smaller than 3 (1 and 2) and two values bigger than 3 ([1, 4]). (4 and 5).
The open-end distribution is appropriate for the median. This implies that even if your data has an endless number of values, you may still use it to get the median value. In other words, it doesn't matter how many points are in your collection; you have to figure out which point is exactly halfway between them after calculating their average. But remember that it's impossible to identify a median when working with continuous variables (like age) because there isn't a clear boundary between one and the other.
It is firmly established. This indicates that the median has a distinct value for a certain set of data values. On the other hand, there are two possible values for the mode when computing it (bimodal distributions).
It is simple to comprehend and compute. It may occasionally be easy to find by visual investigation.
By creating histograms, it is feasible to calculate the median graphically. 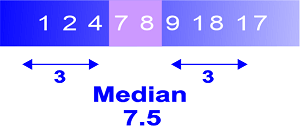
When examining skewed distributions, it is employed because it is unaffected by extreme values. Extreme values do not, in the least bit, influence it. This is because the median of the data is determined using the relative positions of the data values.
It is calculable for distributions with open-end classes.
We can use the median to analyze the central tendency for qualitative data where attributes can be sorted in ascending or descending order. However, the arithmetic mean cannot be used to analyze traits like intelligence, beauty, etc.
The total absolute deviation of the data values from the median is smaller than any other value. As a result, the median is the most likely contender to represent the data set's core value. 
Disadvantages of Median:The median has an approximate p-value of 0 since it is a non-parametric test. So, a low p-value doesn't always indicate the presence of an outlier. Rather, it suggests that there could be one. In addition to utilizing the median, if you want to be certain whether an outlier exists in your data set, you can perform a parametric test like a t-test or an ANOVA. The drawbacks include the following:
It is impossible to pinpoint the median when there are exactly even numbers of observations. Taking the mean of the two middle terms is all we do to estimate it.
The term "median insensitivity" is occasionally used to describe this quality. The median, for instance, is 50 when the range is 10, 25, 50, 60, and 65. Without changing the median's value, observations 10 and 25 can be swapped out for any values less than 50 and 60 and 65 for any values higher than 50.
There is, for instance, a formula for the combined arithmetic mean given the means of two data sets. However, we need to determine the merged data set's median given the two data sets' median.
The variance of sampling has a significant impact on the mean when compared to other variables.
For tiny data sets, medians can easily be located manually because they don't need math. The median cannot be determined manually for larger data sets since even a modest number of observations must be arranged in order, which is highly tiresome.
This is not appropriate for fractional numbers or percentages. If you choose the median as your average, you won't be able to determine what percentage of your data corresponds to a certain value. You won't be able to precisely determine the number between two observations because fractions can only be expressed as integers. The ConclusionThe median wage in America is $31,660, while the average income is $52,851. The average is the total of all values divided by the total number of values. The median is the value in the middle, of which half is used as the first value and the other half as the second.
Next TopicAdvantages and Disadvantages of Tally
|
 For Videos Join Our Youtube Channel: Join Now
Feedback
- Send your Feedback to [email protected]
Help Others, Please Share


