| |

Bar GraphsWe work with a lot of numbers when studying math. Examples include fractions, integers, and equations. However, constant number-gazing can become quite frustrating and perplexing. Because of this, we occasionally use bar graphs, tables, charts, and other visual aids to make sense of all these numbers. 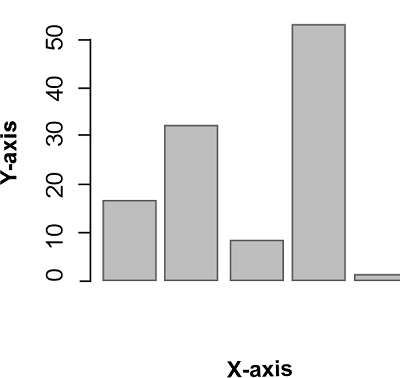
Let's start by learning about the bar graph. Bar graphs are a frequent way to display business data in real life. A bar graph is a type of data visualization that uses rectangular bars with each bar's length proportionate to the value it represents. It uses bars of various heights to portray the data graphically. What is a Bar Graph?A bar chart is an effective tool. Data that are unconnected to one another and do not need to be displayed in any particular order can be represented in one way by processing data. In a bar graph, which shows all the data, the heights of the rectangular bars are proportional to the values they represent. We can display the graph's bars either vertically or horizontally. The bars offer a visual way to compare quantities across many categories. Here is a scenario where a bar graph might be useful. Let's say you want to know which type of chocolate, A, B, or C, your peers like best. You then ask them to put their preference in writing. You create a frequency table once you have all the data. Plot a bar graph after determining the frequency of each option. One glance at the bar graph will reveal which chocolate is more popular. This is how a bar graph functions. Reading data is quite simple as a result. 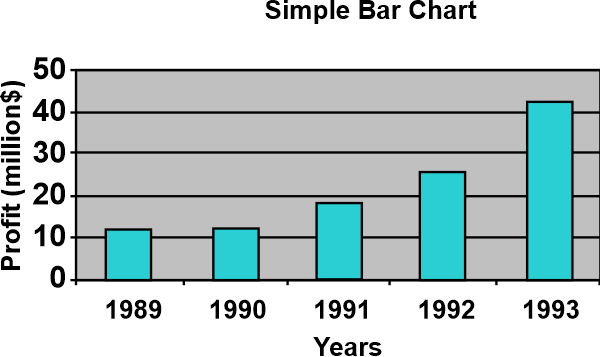
Characteristics of a Bar GraphSome traits that distinguish a bar graph from other types of graphs are listed in the list below:
What Qualities Characterize a Bar Graph?The following are a bar graph's characteristics:
Bar Graph ApplicationsMost often, statistics and mathematics will utilize a bar graph. Examples of applications for bar graphs include the following:
Various Bar Graph TypesThere are two basic categories for bar graphs: V-shaped bar graphs and Vertical Bar Diagrams.Bar graphs can plot their bars either horizontally or vertically. However, the vertical bar graph is the most frequently used. There are two other types of bar graphs in addition to the vertical and horizontal ones described below. Let's examine each type of bar graph in further depth. VerticalBar GraphsOn the x-axis, the rectangular bars are painted vertically. The quantity of the variables listed on the x-axis is represented by the height of the rectangular bars, which is displayed on the y-axis. 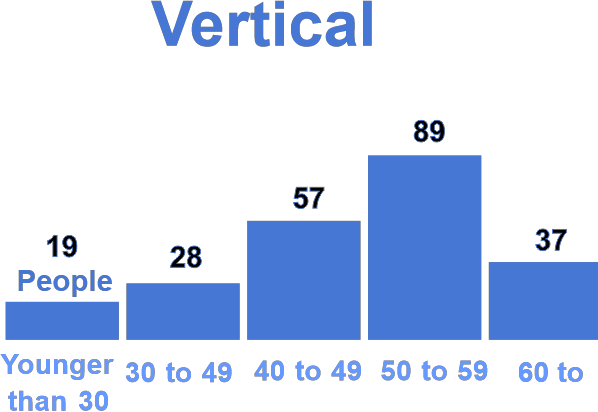
Horizontal Bar GraphsIn this design, the length of the rectangular bars on the x-axis represents the values of the various variables in the data. Before showing the rectangular bars horizontally on the y-axis, we must first specify the categories or variables of the data. 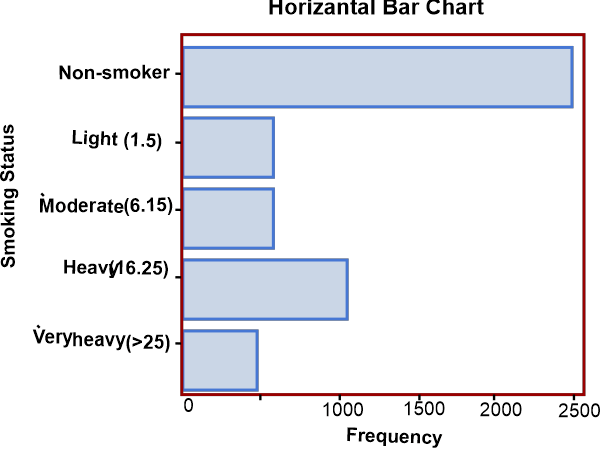
Graph of Stacking BarThe stacked bar graph is also the composite bar graph. It cuts the bar into various pieces. To make it simple to distinguish between the various categories, each bar component in this uses a different colour to symbolize it. As a result, each rectangular bar in a stacked bar graph depicts the entire, and each segment of the rectangular bar displays the many components of the whole. Either vertically or horizontally can be displayed. To identify the various components of the bar, precise labelling is required. Grouping of BarsIt displays the discrete value for data from two or more categories. The secondary category level is depicted by the same colours within each group of rectangular bars grouped by position for levels of a single categorical variable. Both a vertical and a horizontal display are possible. Look at the illustration below to see several bar graphs kinds. 
How To Draw A Bar Graph?Let's learn how to create a bar graph using an example. Liza went to the store to buy several fruits, including 6 oranges, 3 watermelons, 3 strawberries, 5 apples, and 3 mangoes. To discover which fruits she buys most frequently, she wants to make a bar graph to illustrate the data. Let's follow steps: Step 1: Take a sheet of graph paper and write "Most Bought Fruit" in the captions of the bars. Step 2:Draw the horizontal (x-axis) and vertical (y-axis) axes on a plane. Step 3:Next, identify the dependent category on the vertical axis, "Number of Fruits," and the independent category on the horizontal axis, "Types of Fruits." Step 4: With an equal amount of space between each fruit, the names of the fruits, such as apples, mangoes, watermelons, strawberries, and oranges, should be printed on the horizontal axis. Step 5:Explain the scale of the graph while demonstrating how numbers represent the data. Object measurements are aided by a system of markers placed at predetermined intervals. For instance, we could write the scale of a graph as 1 unit Equals 1 fruit. Step 6:Begin assembling rectangular bars for each fruit, leaving adequate distances between them and giving appropriate numbers to their heights. Step 7: To determine which fruit is the most popular, measure the height of the rectangular bars for each after the bar graph is complete. It is crucial to note four elements while creating a bar graph: The title, scale, and names of the axes. Bar Graph Versus HistogramThe main difference between histograms and bar graphs is that histograms have bars that are contiguous to one another, whereas bars in a bar graph do not. A histogram is a type of graph that employs rectangular bars with no spaces between them to display data. In contrast, a bar graph uses rectangular bars with equal intervals between them to depict accurate data. While bar graphs are used to compare various variables and to depict categorical data, such as information on the various kinds of animals, colours, and movies, among other things, histograms are used to depict variable distributions and quantitative plot data, such as information on population change over time, grade distribution, and monthly wages. The histogram and bar graph have comparable appearances. However, there is a significant difference. They plot various kinds of data, which is the primary distinction between them. Discrete data is represented in a bar chart, whereas continuous data are plotted in a histogram. The bar chart is ideal because it compares items among many groupings, such as dog breeds and TV programs, when we have diverse categories of data. The histogram is the best option, for instance, if we have continuous data like the people's weight. Pie Chart and Bar Graph DifferencesOne kind of graphical depiction is a pie chart. The pie chart has sections and is round in shape. Each component shows a portion of the entire. In contrast, a bar graph depicts discrete data and contrasts it with other data. Bar Graph and Line Graph DifferencesThe following are the main distinctions between a bar graph and a line graph:
Important RemindersHere are some crucial observations regarding the bar graph:
Advice for Bar GraphsSeveral crucial bar graph recommendations are provided here.
What are the Short Comings of a Bar Graph?A bar graph's drawback is that it frequently needs further explanation and misses important underlying concepts, factors, and patterns. Furthermore, it is susceptible to the manipulation of false information. What Practical Applications Do Bar Graphs Have?Bar graphs are frequently used in business to provide information to clients and staff members, such as sales data. People also use bar graphs for private purposes, such as managing their finances. What Constitutes a Bar Graph?
The bar graph's title makes clear what the graph is about. It depicts the data that we ultimately extrapolate from the graph supplied. For instance, the most popular colour among students, the cost of cars, or the weekly sales of cakes. Making and Using a Bar GraphData collection: Collecting data is the initial step in creating any graph. Make sure you get information for all categories because bar graphs are comparison studies. Make an axis:A graph always has two axes. Create the x- and y-axes. Identify the axis:Label the x-axis first. We represent the categories on the x-axis. As an illustration, the x-axis is labelled with the names of the chocolates, A, B, and C. Label the y-axis after that. To do this, plot the points on the y-axis based on the highest frequency. Sketch the Columns:The bars are then drawn. The bars are typically not continuous or joined. Extend the bars, starting at the base value to the associated frequency. Take a rough point between the two if the value is between the plotted frequencies. Once the bar graph is complete, we may interpret the data. The selections that are most and least popular can be determined. We can also find anomalies. A Sample Bar GraphDeliveries will happen within the time frame promised by a delivery service. In peak and off-peak hours, the service wants to assess how well they keep this promise. Two categorical variables, each with two values, are used in the dataset for this graph, and as a result, there are four possible combinations into which observations may fall: Delivery Status: Late, On-time Delivery Time: Peak, Off-peak 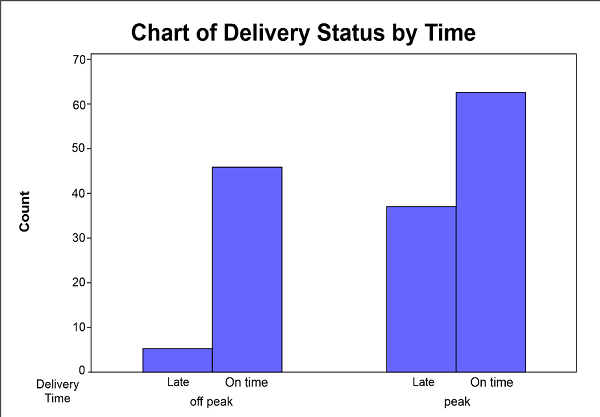
Typically, bar charts have the following components: Counts, variable functions (average, sum, standard deviation), or other summary values are represented on the Y-axis. On the x-axis, categories or discrete values are represented. Symbolized by vertical bars, each category's value. The bars could also be stacked or clustered in groups to make comparisons easier. The bars for the delivery data show the number of observations for each of the four potential categorical value combinations. The graph demonstrates that during peak hours, more deliveries take place than during off-peak hours. There should be more deliveries that are made after normal business hours. But during busy times, many more deliveries are delivered late. The service should prioritize reducing delivery delays during busy times. Making a Bar Graph in Excel: A Step-by-Step GuideThe independent variable (in our example, the names of each album) and the dependent variable are necessary for creating a bar chart (the number sold). Use these simple instructions to make an Excel bar graph.
Excel Bar Graph Creation GuidelinesBy clicking on the title and entering the new title, you can alter the title of your chart at any moment. When you press Enter, your text will be typed in the Formula Bar and replaced with the current title. By selecting Move Chart from the Design tab, you may leave the bar graph as it is or move it. It can either be a new sheet or an object on any existing sheet in your workbook. The Design and Format tabs should be noted as contextual, meaning they only appear when a chart is selected. There is no need to start over again if you decide to use one of the alternative chart formats. Select Change Chart Type from the Design tab by simply clicking the chart.
Next TopicWhat is Graph
|
 For Videos Join Our Youtube Channel: Join Now
Feedback
- Send your Feedback to [email protected]
Help Others, Please Share


