| |

Count Unique Values in ExcelWhat are called Unique Values?In Excel, the term "unique values" refers to values in a data set or a range of cells that occur only once, without any repetition or duplication. Essentially, it means that each value in the set is distinct and appears only once. Unique values can be found in various types of data, such as lists of names, addresses, numbers, dates, or any other type of information. Identifying and working with unique values is important in many fields, such as data analysis, database management, and information technology. Understanding unique values are important in data management and analysis, as it allows you to gain a clearer and more accurate understanding of your data. Methods to calculate unique values in ExcelIn excel there are several methods to calculate the unique values in Excel. The methods are explained as follows, 1. Using Sum-Product and Countif FormulaCombining Sum-Product and Countif formulas helps find the unique values in Excel. The steps to be followed are, Step 1: Enter the data in the worksheet, namely A1:C11 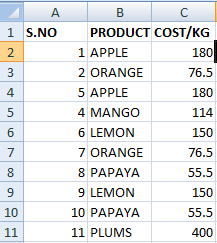
Step 2: Select a new cell where the user wants to display the result and enter the formula as =SUMPRODUCT (1/COUNTIF (B2:B11, B2:B11)) Step 3: Press Enter. The formula returns the number of unique values present in the selected column. 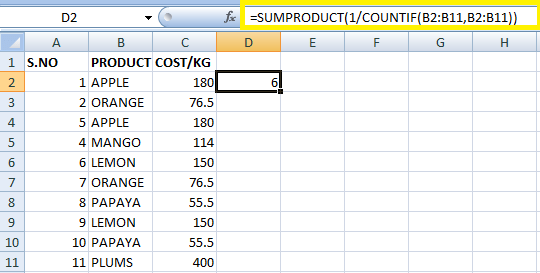
In the worksheet, the total value present is 11, and the formula returns the unique value of 6 among the 11 values. Working Process of the FormulaThe syntax of the formula is, =SUMPRODUCT (1/COUNTIF (data, data)) The formula data represents the RangeRange that needs to be calculated to find the unique values. The COUNTIF function calculates the number of times the data is repeated in the selected RangeRange. Here the RangeRange selected is B2:B11 and represented in array format. The COUNTIF formula divides the result of the array called divisor with one as a numerator called a dividend. For example, if the COUNTIF formula returns the data count as{4,4,1,5}, it is divided as {1/4,1/4,1/1/,1/5}. Except for the value 1, the other value gets the fraction result as {0.25, 0.25, 1, 0.2}. The SUMPRODUCT adds the value in the array and displays the result. What happens if an empty cell is present in the data range?In this example, an empty cell exists in the data range while counting the unique values. It displays the result as follows, 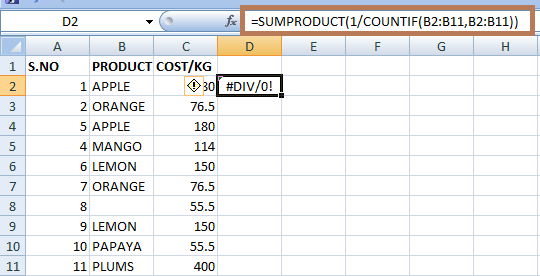
The COUNTIF returns the value zero for every empty cell; while calculating the value, the SUMPRODUCT function returns the value as 1/0=0, called #DIV/0! Error. To rectify this error, the formula is modified as, =SUMPRODUCT (((data<>"")/COUNTIF (data, data&""))) Here data represents the RangeRange which needs to be calculated to a unique value. In this example, the formula is written as =SUMPRODUCT (((B2:B11<>"")/COUNTIF (B2:B11, B2:B11&""))) 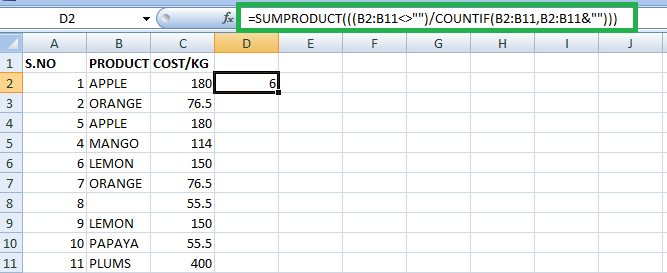
Here, the function doesn't return divide by zero error; it returns the number of unique values in the cell. 2. Using SUM and COUNTIF functionThe combination of SUM and COUNTIF calculates the distinct values in the selected cell range. Step 1: Enter the data in the worksheet, namely A1:C11. Step 2: Select a new cell where the user wants to display the result and enter the formula as = SUM (IF (ISTEXT (B2:B11), 1/COUNTIF (B2:B11, B2:B11),")). The range represents the selected RangeRange that needs to be calculated. Step 3: Press Ctrl+Shift+Enter. The curly brace surrounds the formula. 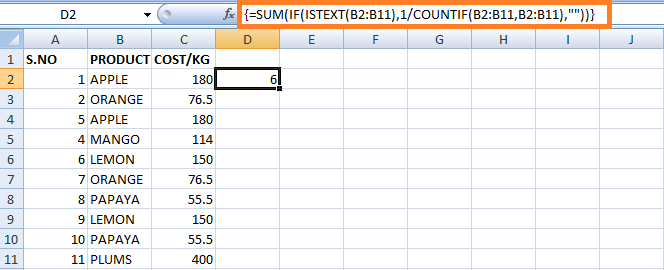
Working Process of the FormulaIn the formula, the ISTEXT function returns the value true for the cell containing text and False for other cells. The COUNTIF function counts the number of times the text is repeated in the selected cell range. The COUNTIF formula divides the result of the array called divisor with one as a numerator called a dividend. For example, if the COUNTIF formula returns the data count as{ 2, 2,1,5}, it is divided as {1/ 2,1/ 2,1/1/,1/5}. Except for the value 1, the other value gets the fraction result as {0.5, 0.5, 1, 0.2}. The SUM function sums the value in the array and displays the result. 3. Sum, Frequency, and Match FormulaThe Sum, Frequency, and Match formulas find the distinct values from the given data set. SUM- The SUM formula in Excel adds up a range of values or cells. To use the SUM formula, select the RangeRange of cells you want to add and type "=SUM(" into the cell where you want the total to appear. Then, select the range of cells you want to add and close the bracket by typing ")." The formula should look like this: =SUM (RangeRange of cells). Frequency- The FREQUENCY formula in Excel counts the number of values that fall within a certain range or bin. To use the FREQUENCY formula, specify the RangeRange of data and the bins you want to use. Then, you can use the formula to create an array of values representing each bin's frequency. Match- The MATCH formula in Excel is used to find the position of a value within a range of cells. To use the MATCH formula, specify the value you want to find, the RangeRange of cells you want to search, and the type of match you want to perform (exact or approximate). Step 1: Enter the data in the worksheet, namely A1:C11. 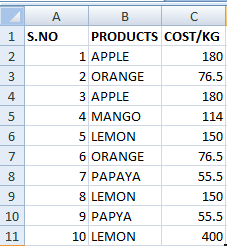
Step 2:Select a new cell where the user wants to display the result and enter the formula as =SUM(IF(FREQUENCY(IF(B2:B11<>",MATCH(B2:B11, B2:B11,0)), ROW(B2:B11)-ROW(B2)+1),1)) Step 3: Press Ctrl+Shift+Enter. The number of unique values will be displayed in the cell selected cell. 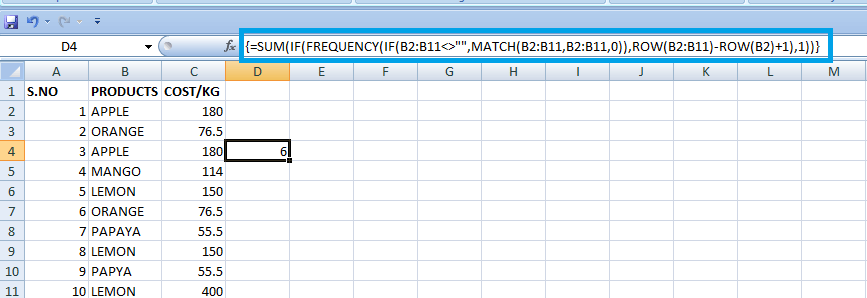
Working Process of the FormulaThe general syntax of the formula is as follows, =SUM(IF(FREQUENCY(IF(data<>"",MATCH(data,data,0)),ROW(data)-ROW(firstcell)+1),1)). Data - The selected data range is called RangeRange. First cell- The first selected cell range is called the First cell. The Frequency formula is used to find the unique values in the selected RangeRange. As it works with numbers, the given values are converted to numbers. The MATCH function returns the position of the items that appeared in the data range. If any duplicate values are found, it returns the first occurrence of that value in the data range. The IF statement is used to apply conditions for the data range. If the empty cell is present, the MATCH function returns the #N/A Error. Therefore, the IF statement applies the condition data <> ". The Frequency function returns how often the value is returned in the selected date range, and the IF function returns the value '1' for unique values and 'FALSE' for duplicate values. 4. User Defined FunctionHere's an example of a user-defined function in Excel that counts the number of unique values in a range: Step 1: Open Microsoft Excel and create a new workbook. Step 2: Press "Alt + F11" to open the Visual Basic Editor. Step 3: Click "Insert" from the top menu and choose "Module" to insert a new module. 
Step 4: Paste the following code into the module Function CountUnique(rng As RangeRange) Dim dict As Object Set dict = CreateObject("Scripting.Dictionary") Dim cell As Range For Each cell In rng If Not dict.exists(cell.Value) Then dict.Add cell. Value, 1 End If Next cell CountUnique = dict.Count End Function Step 5: Save the workbook and return it to Excel. Step 6: Enter a range of values into a cell range, for example, A1:C11. Step 7: In another cell, enter the formula "=Count Unique (B2:B11)" and press Enter. Step 8: The result will be the number of unique values in the RangeRange. 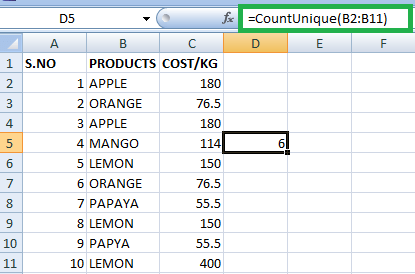
Using the VBA formula, the CountUnique function counts the number of unique values in the selected RangeRange. 5. Using Filter OptionYou can use the "Advanced Filter" feature in Excel to filter a range of data and find unique values. Here's how: Step 1: Select the RangeRange of data you want to filter, including any column headings. Step 2: Click the "Data" tab in the ribbon menu. Step 3: Click "Advanced" in the "Sort & Filter" section. 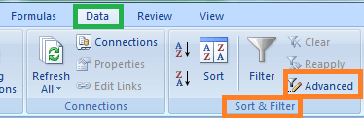
Step 4: In the "Advanced Filter" dialog box, select "Copy to another location" and specify a location for the filtered data. Step 5: In the "List range" field, enter the cell range for the data you want to filter. Step 6: In the "Copy to" field, enter the location where you want the unique values copied. Step 7: Check the "Unique records only" box. Step 8: Click "OK" to apply the filter. 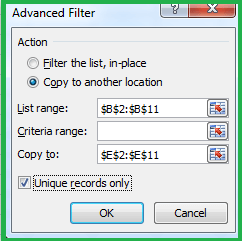
Excel will filter the data and copy only the unique values to the specified location. The filtered data will also include the column headings from the original RangeRange. 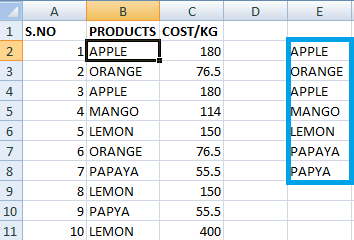
SummaryIn Excel, finding unique values can be helpful in various scenarios, such as data analysis, filtering, and sorting. Finding unique values in a column allows you to quickly identify distinct categories, eliminate duplicates, and obtain a data summary. In summary, finding unique values in Excel is a useful data manipulation technique that can help you gain insights into your data quickly and efficiently. It can also help you clean your data and remove duplicates, leading to better data quality and more accurate analysis. |
 For Videos Join Our Youtube Channel: Join Now
Feedback
- Send your Feedback to [email protected]
Help Others, Please Share


