| |

Creation and Working of Region Map in KibanaIn this section, we are going to learn about the creation of the Region Map and about its features. We will also learn the use to the Kibana's dev tool in the for the creation of the Region map. Index Creation for the Index MapIn order to work with the visualization of the area map, we are going to upload a data set. A glimpse of the dataset is shown in the image below. 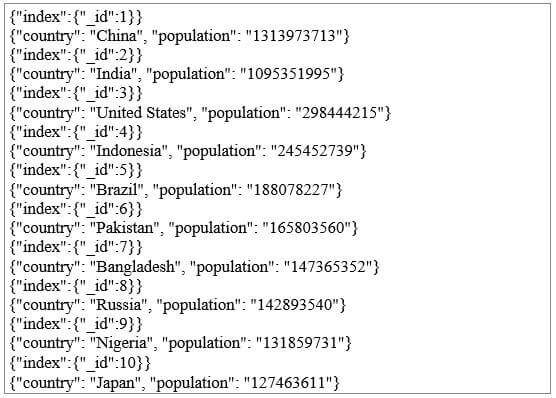
Notice that in dev tools, we will use bulk upload to upload the data. Now, we need to go to the Kibana Dev tool as we did in the earlier visualization process and run some of the query. A glimpse of the query is as follows. Now let's build the Index first, which will be named as All countries. Here we have defined the country field type in our visualization as a keyword. So, for that we need to run some query. The query that we need to run is shown in the image below. And one must note that, if we need to create the area map then it is mandatory to specify the type of the field or keyword that we want to use in the sort aggregation function. 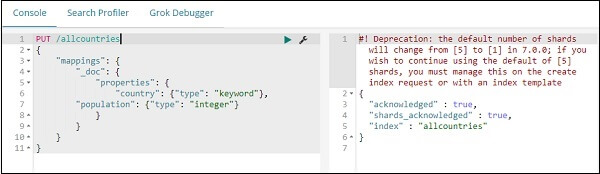
Now here we need to upload the data that we want to insert in the index by using the bulk command and it will run until it finishes. 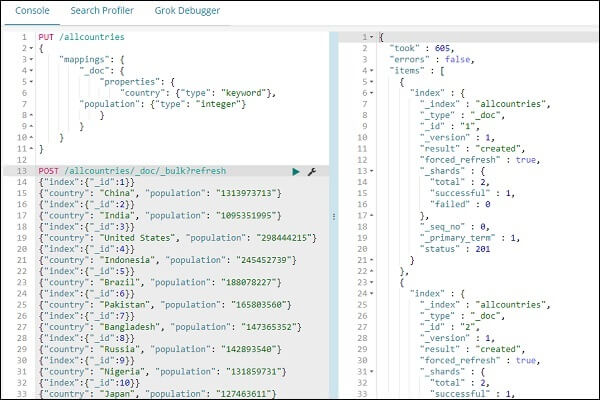
Now here in this step, we are going to build the pattern of the index that we want to use in our visualization. So, for that we need to go to the Management tab that is present at the main dashboard and then choose the option Create a pattern for the index option. For the reference, have a look at the image below. 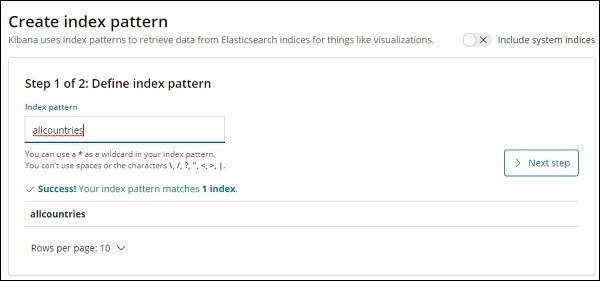
Now, after this step, we can clearly see the data that is present in the All countries index and its type and some other information on the screen. For the reference, have a look at the image below. 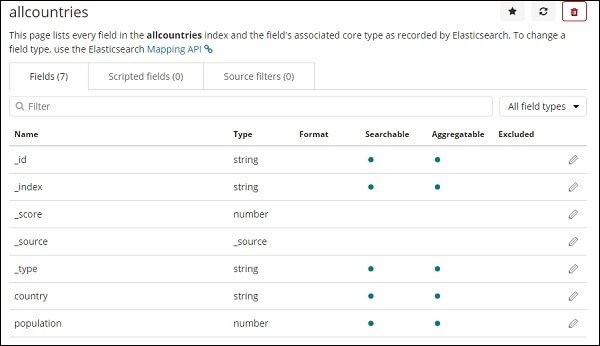
Region MapsUsing Area Charts, we will create the visualisation now. Select Area Maps and go to Visualization. By using the option of the Region Map we will be creating the visualization. So, for that we need to click on the Region map which is present in the visualize option which is visible in the right dock bar as we can see it in the image below. 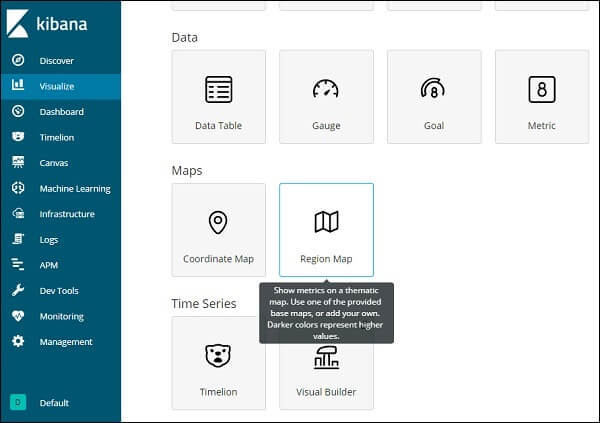
Once it is done, now we need to pick and continue as the all countries index. Now, the next step is same as we did in our last visualization. So now in order to use the aggregation function on the map we need to pick the Aggregation Metrics and Bucket Metrics as shown in the figure below . And we will fill the Count value in the Aggregation option in the mertix . 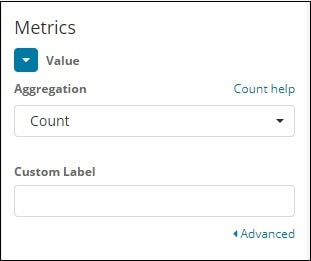
And in the Buckets dialog box, in the option of fields we need to write the country, order by as metric: Count etc for the reference look at the image and we will fill all the details accordingly as we want to display the information. 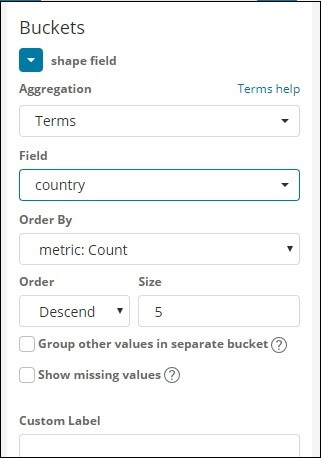
Next TopicVisualization in Kibana
|
 For Videos Join Our Youtube Channel: Join Now
Feedback
- Send your Feedback to [email protected]
Help Others, Please Share


