| |

Creation of Dashboard in KibanaIn this section, we are going to learn about the creation of the dashboard in Kibana tool. We will also learn how we can use these options at its best and how we can make our dashboard look more attractive. Dashboard in KibanaA dashboard is a list of your visualisations, so that all of them can be displayed together at a time. To create a dashboard in Kibana, first we need to click on the Dashboard option available in the Kibana window. For the reference have a look at the image below. 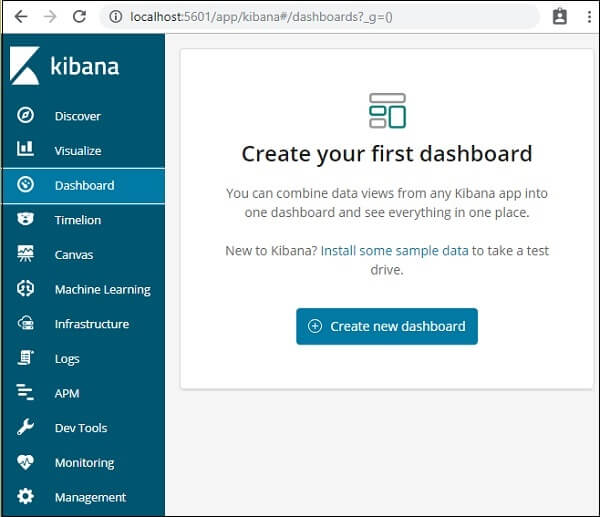
Now as we can see in the window above, there is a button to create new dashboard, click on that button. As shown in the image below, it will lead us to a new window. 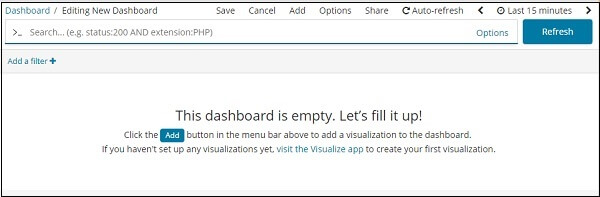
Notice that we have not built any dashboards so far. At the top, there are choices where we can save, cancel, add, choices, share, auto-refresh and adjust the time to get the details on our dashboard as well. By clicking the Add button shown above, we'll build a new dashboard. Adding Visualization to our newly created DashboardNow here we need to click on the add button so that we can start creating the visualization. 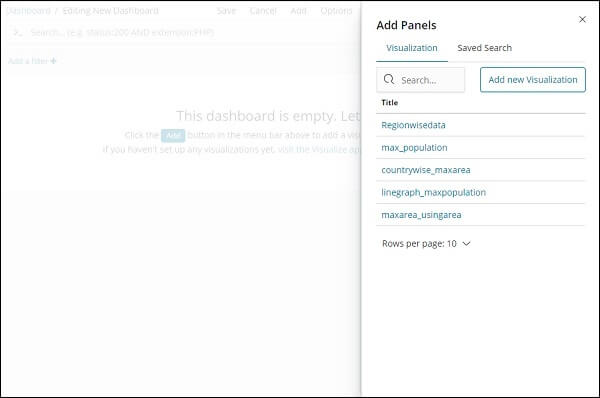
Now we can choose the visualisation that we want to add to the dashboard. As shown in the list just below the Add new visualization button, we will pick the first three visualisations from there. 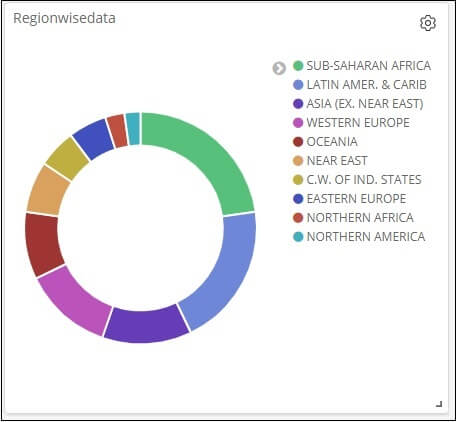
This is how it will be seen on the dashboard. 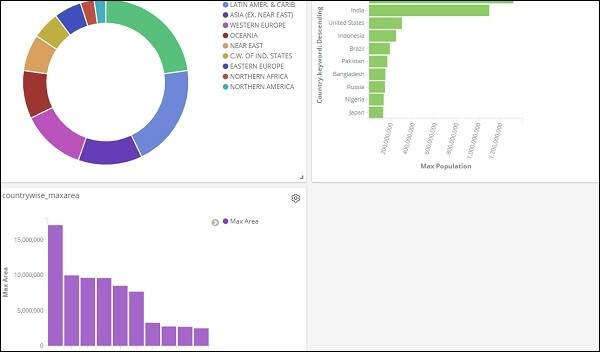
As a user, we can therefore obtain the general information of the data we have uploaded-country-wise with country-name, region-name, area and population fields. So now we know all the regions open, in descending order, the max population country wise, the max area etc. Kibana will show us every hour, minute, seconds data as we want to see in our sales visualisation right in front of our eyes and it will be exactly as per our requirement. It presents the data in real time as it happens in the real world. Saving the Created Dashboard in KibanaTo save our dashboard created in Kibana tool we just need to click on the Save and our dashboard is saved. 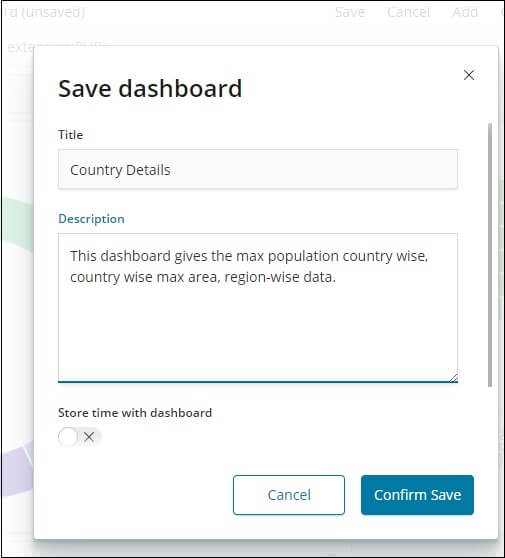
There is a title and description where the dashboard name can be entered and a quick description that says what the dashboard is doing. Now, in order to save the dashboard that we have created, just click on the button that states Confirm Save. Time Range of DashboardWe can currently see that the data displayed is from the last 15 minutes. If we have the data linked to the real-time device altering the time, the reflecting data will also be seen. By design, the last 15 minutes are shown as shown below. 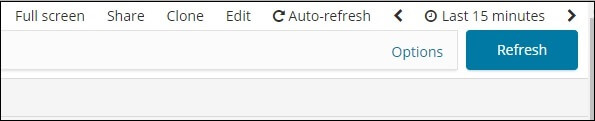
Click on the last 15 minutes and the time span that we can choose according to our preference and that will be shown to us. Note that there are options for rapid, relative, absolute and recent options. The image below is the reference that states the quick options that we have in our Kibana time range list.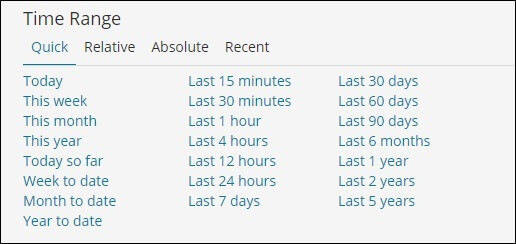
Now, if we want to create and alternative option and it must be according to our need then we need to click on the Relative option which is present at the adjacent right of the Quick option. 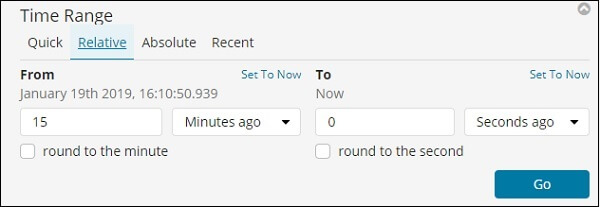
We can fill out the details as per our need in the window above to obtain the data as we please. The Absolute choice has the following information- 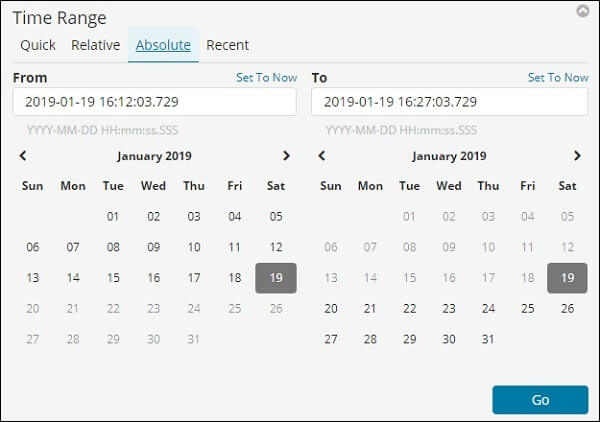
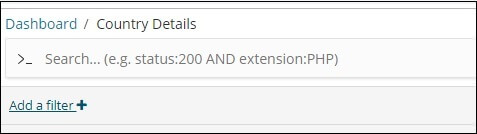
We will see a calendar option and from there a date range can be picked. The new option restores the Last 15 Minutes option as well as the other option that we have recently picked. The data arriving from that time period would be changed by selecting the time range. Use of Search and Filter Option in the DashboardOn the dashboard, we can use search and philtre as well. 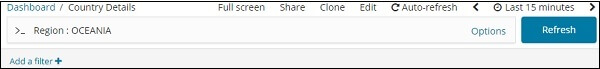
We used the Area field in the above quest and would like to show the Area: OCEANIA information. We get the following outcomes 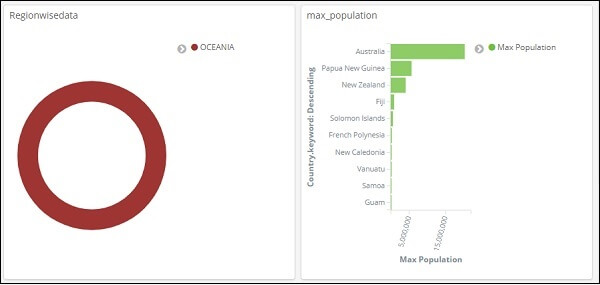
Looking at the data above, we can conclude that Australia has the highest population and area in the OCEANIA region. 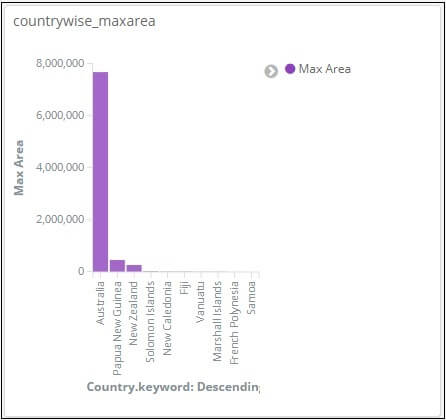
Likewise, as shown below, we may add a filter- 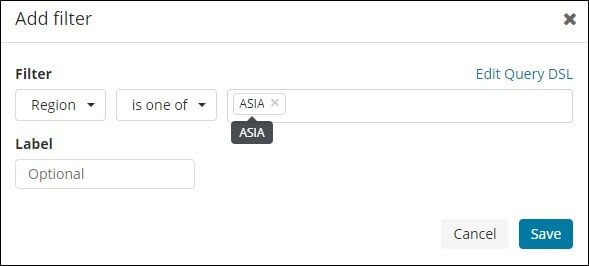
Next, click the Add Filter button and the field information available in our index will be displayed as shown below: 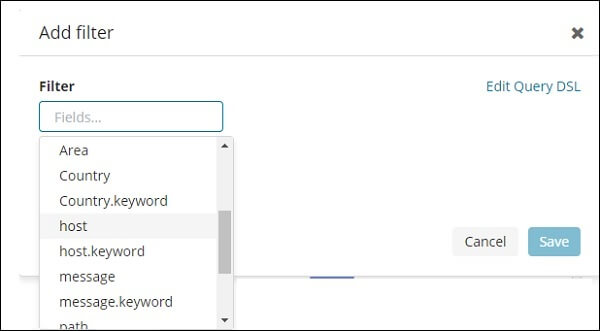
Now we need to select from the area from which we want to filter. To get the ASIA region information as shown below, we will use the Region area. Save the filter and the filter should be seen as follows, 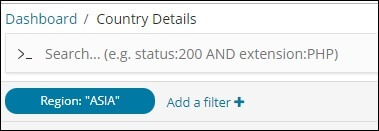
The data will now be seen as per the added filter. 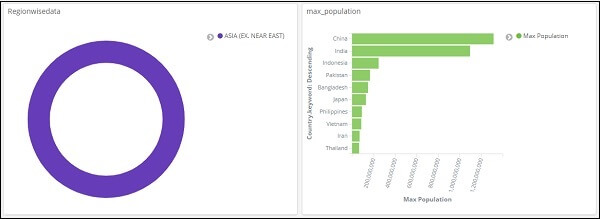
We can ever add more filters as per our need. 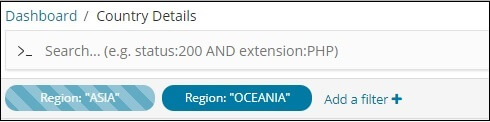
Also, if we want, we can even disable the filter as shown in the image below. below. 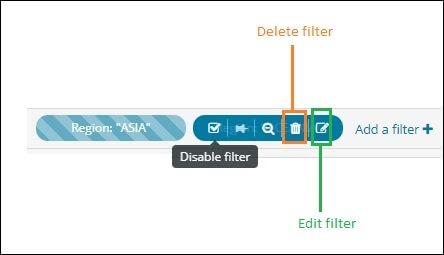
In the chart, we can see their dots on the top right corner of the chart. Click on that option. 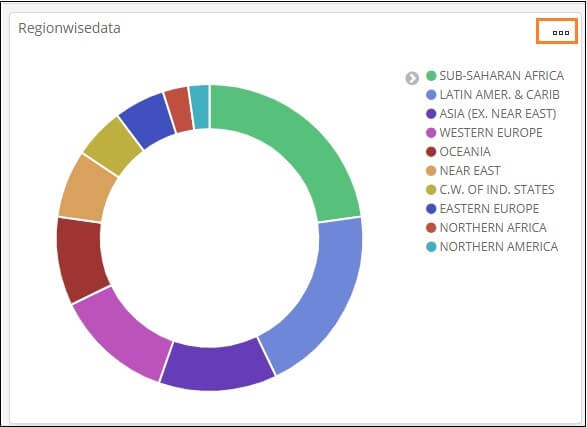
After we click on it, it will show us the few options as shown in the image below. 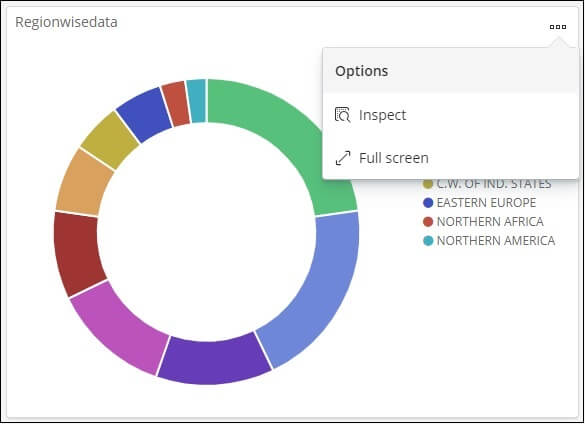
The Inspect Option and The Fullscreen Option use in KibanaClick Inspect and it gives the area information as shown below in tabular format. 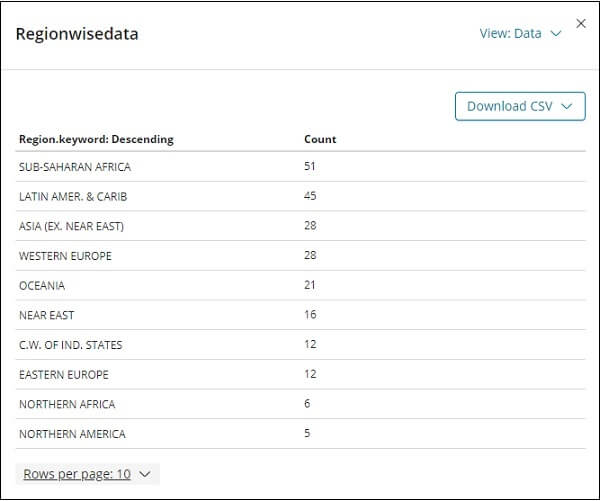
We can also download the data in the above chart in the.csv format by clicking on the button, if we want to watch our data in the excel. The next full screen option will be shown in full screen mode, as shown below. 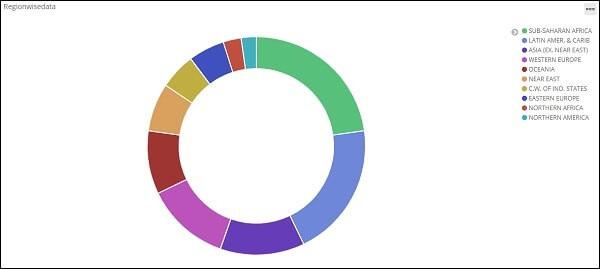
We can exit from full screen mode by using the same button. Sharing DashboardUsing the sharing button, we can start sharing the dashboard. If we press the sharing button, we will be shown the option as follows: 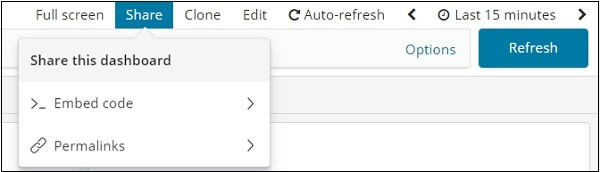
We can also view the dashboard on our website using embed code or use permalinks that will be a connexion to share with others. 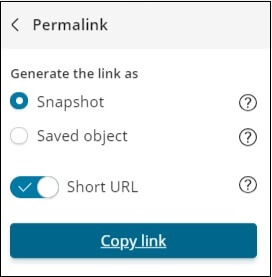
To show the data we will need a URL, that is: http://localhost:5601/goto/519c1a088d5d0f8703937d754923b84b
Next TopicCreation of Timelion
|
 For Videos Join Our Youtube Channel: Join Now
Feedback
- Send your Feedback to [email protected]
Help Others, Please Share


