| |

Creation of Timelion in KibanaIn this section, we are going to learn about the creation of the Timelion visualization of Kibana. We will also learn about how and where to use the Timelion, what are its uses and what are the different aspects and fields of the Timelion visualization in the Kibana. Another visualisation method is Timelion, also known as a timeline, which is primarily used for time-based data analysis. Timelion visualization in KibanaWhen we want to compare data related to time, Timelion is used. We have a blog, for instance, and we get our views every day. We want to evaluate the data in which we want to equate the information of the current week with that of the previous week, i.e. Monday-Monday, Tuesday-Tuesday and so on, how the thoughts and even the traffic varies. Visualization with TimelionNow in Kibana dashboard, we need to click on Timelion option that is present on the left slider menu just below the Dashboard option. For the reference use the image below. 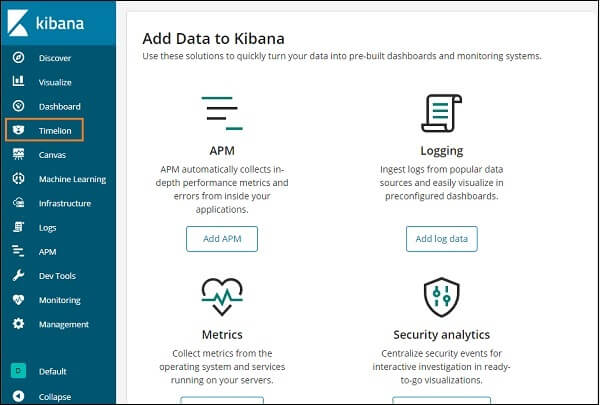
The main feature of the Kibana Timelion is to displays the time line of all the indexes that are present. 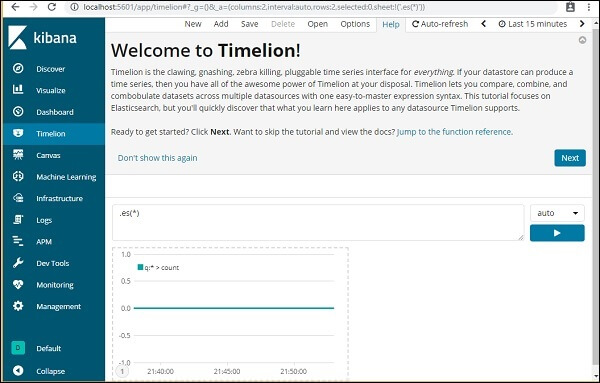
The Timelion feature in the Kibana basically deals with syntax for phrases. es (*) means that it will aal the present indexes. Just click on the text area as shown below to get the feature information available for use with Timelion. 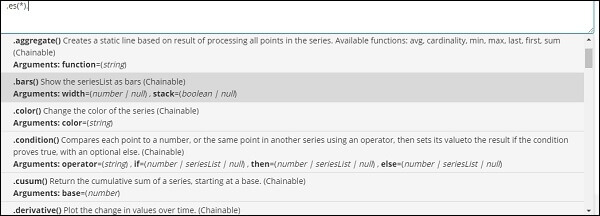
The welcome message is displayed in the Kibana Timelion once the user starts working with the Timelion. Part illustrated, i.e. Jump to the reference of the function, which provides descriptions of all the functions available for use with timelion. Welcome Message by TimelionThe welcome message from Timelion, as shown below, is 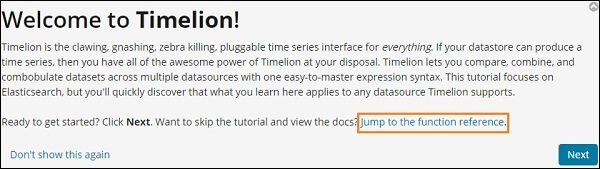
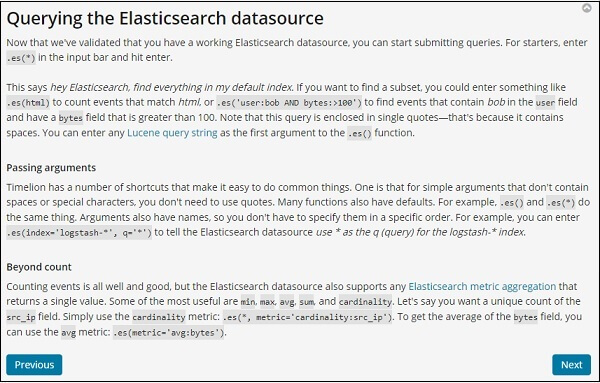
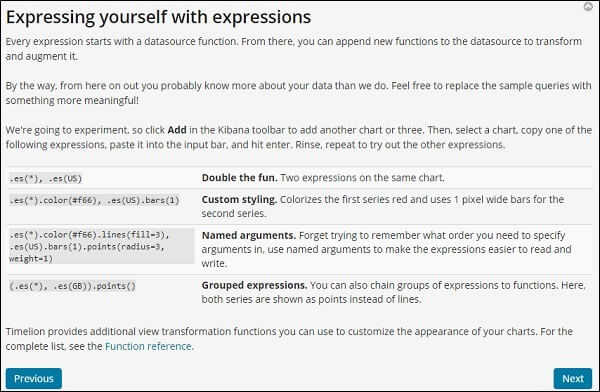
Click the next button and its basic features and use will guide we through it. Now when we will click on the next, it will show us the following information. For the reference see the image below. 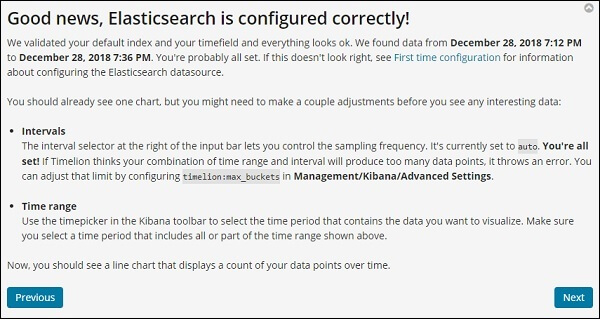
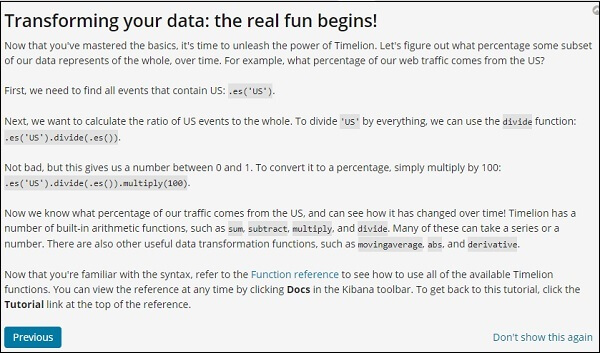
Timelion Function ReferenceIn order to get the full details of the Timelion function reference, one can click on the Help button that is present in the menu bar at the top. 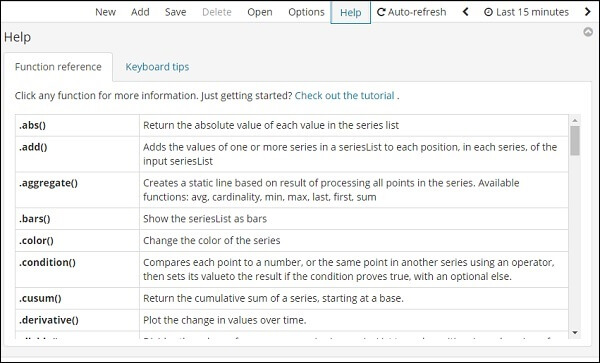
Configuring Timelion FunctionIn Kibana Management ⁇ Advanced Settings, the timelion setting is completed. 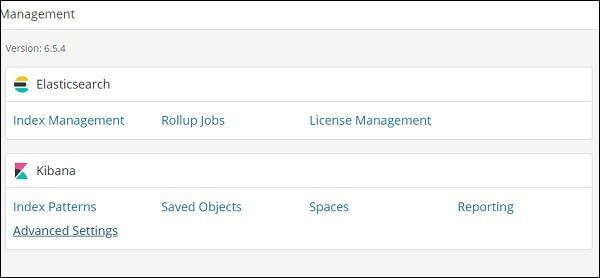
Press Advanced Settings, and from the Category, pick Timelion. 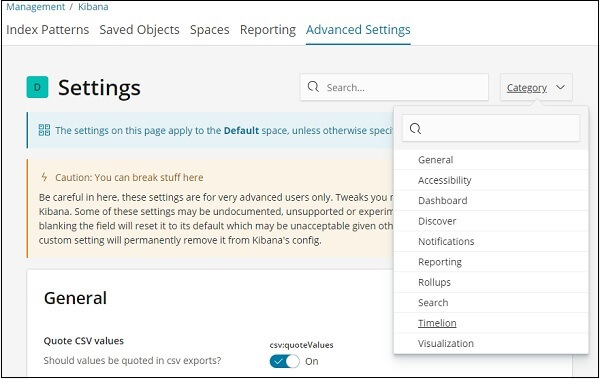
After Timelion is selected, all of the necessary fields necessary for Timelion configuration will be displayed. 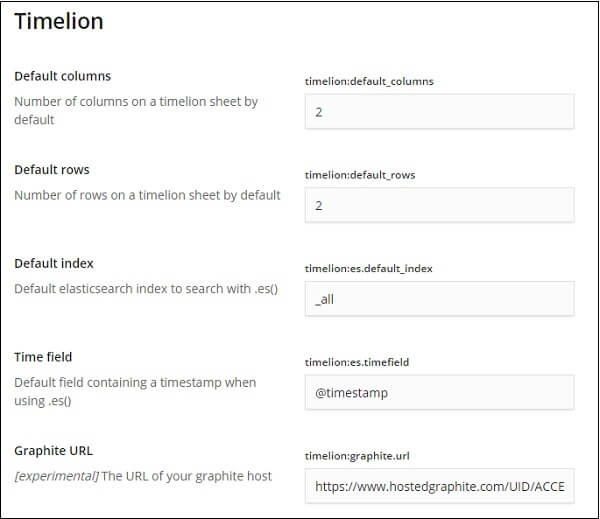
We can adjust the default index and the time field to be used for the index in the following fields - 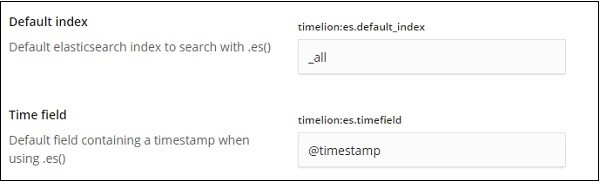
The default one is all and @timestamp is the time area. We 'd keep it as it is and in the Timelion itself, modify the index and Timefield. Data Visualization using Timelion Index: medicalvisits-26.01.2019. We can need it. The data shown from Timelion for 1 January 2017 to 31 Dec 2017 are as follows: 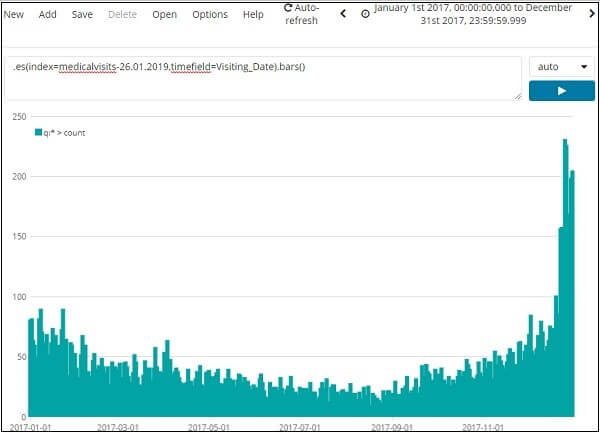
The expression used for the show above is as follows: .es(index = medicalvisits-26.01.2019,timefield = date of visit).bars) We have used the index medicalvisits-26.01.2019 and the timefield is Visiting-Date and the bars feature used on that index. We have evaluated 2 towns for the month of January 2017, day wise, in the following. 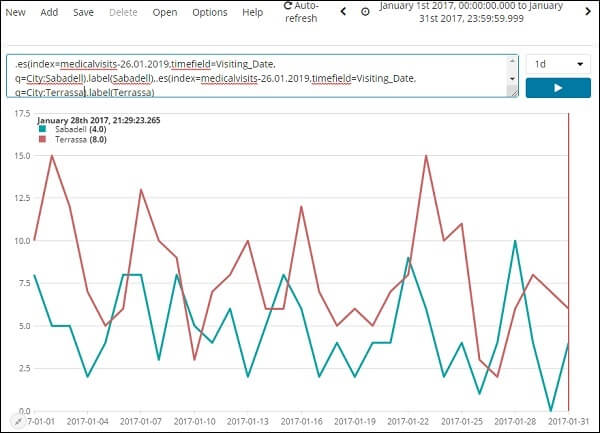
The term used is - .es(index = medicalvisits-26.01.2019,timefield = date of visit, Q = City: Sabadell).label(Sabadell),.es(index= 26.01.2019 patient visits, Timefield = Date of visit, q = City: Terrassa).label(Terrassa) The 2-day timeline comparison is seen here. Expression.es(index = medicalvisits-26.01.2019,timefield = Visiting Date).label("2nd August 2018), .es(index= medicalvisits-26.01.2019, timefield= Date of visit, offset=-1d).label("1st August 2018) We have used offset here and given a 1-day discrepancy. The present date has been selected as 2nd August 2018. So, for 2nd Aug 2018 and 1st Aug 2018, it gives a data gap. 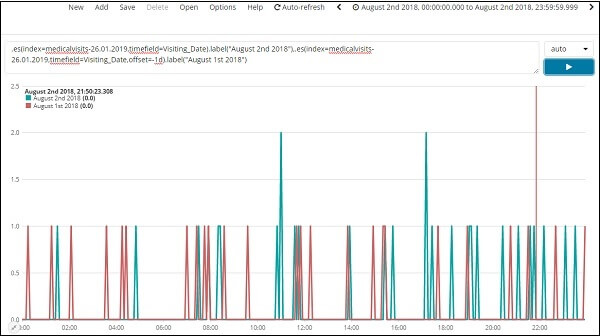
The list of the top 5 data for January 2017 in the cities is shown below. The keyword that we have used in our visualization is given below. .es(index = medicalvisits-26.01.2019,timefield = date of visit, split = city.keyword:5) 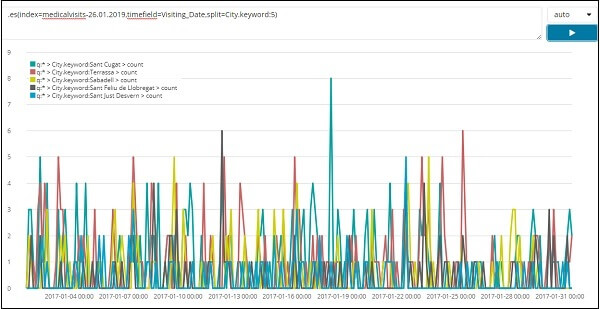
Here in the field options of the visualization we have used the split and have given the field name in the fields as city and we gave it as split = City.keyword:5 because in our visualization we need to show the top five cities from the index. One can select the fields as per his needs and choices, and can change the fields accordingly. It gives each town's count and lists their names as seen in the plotted graph.
Next Topic#
|
 For Videos Join Our Youtube Channel: Join Now
Feedback
- Send your Feedback to [email protected]
Help Others, Please Share


