| |

Data Aggregation in TableauIt is useful to look at numeric values using different aggregations function. Tableau supports many different aggregation types, such as:
In Tableau, you can create aggregation dimensions and measures. Whenever you add measures to your view, an aggregation is applied to those measures by default. The type of Aggregation used depends on the context of the view. If you are not familiar with the database, then refer to Tableau manual for detailed definition of these aggregate types. You are adding fields into the visualization by default then it will be displayed. Tableau allows you to change or alter the aggregation level for a specific view. To change the default aggregation, do right click on that field inside the data shelf and change its default by selecting the menu options (default properties or Aggregation). You can also change the Aggregation of a field for specific use in a worksheet. For example: By right-clicking on the SUM (Sales) pill and selecting the Measure (SUM) menu option, you can choose any of the aggregations highlighted. 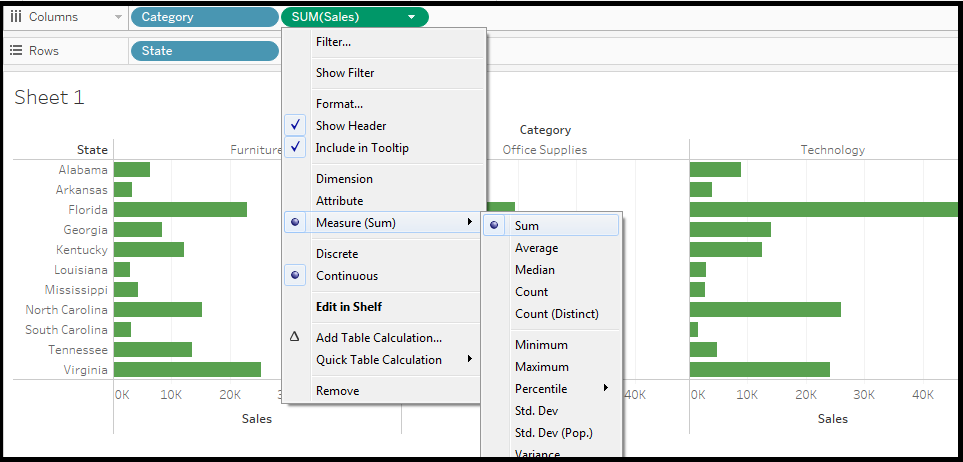
The data source used in the above figure is a data extract of an Excel spreadsheet. It is important to understand that if you depend on a direct connection to Excel, the median and count (distinct) aggregations would not be available. Access, Excel, and text files do not support these aggregate types. Tableau's extract engine do this task. Aggregating MeasuresWhen you add a measure to the view, Tableau automatically aggregates its value. Average, sum and median are the common aggregation functions. The current Aggregation looks like part of the measure's name in the view. For example: Sales becomes SUM (Sales), and every measure has a default aggregation, which is set by Tableau when you connect to a data source. You can change or view the default aggregation for measures.
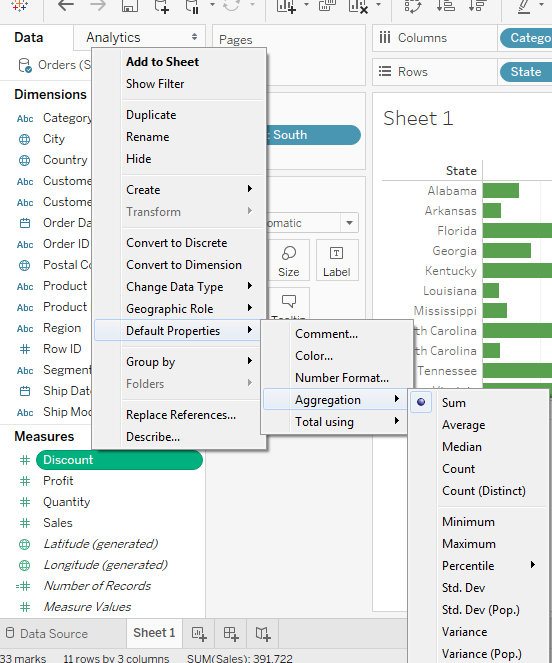
Set the default Aggregation for MeasuresYou can set the default aggregations for any measures. It is not a calculated field that itself contains an aggregate, such as AVG ([Discount]). A default aggregation is the preferred calculation for summarizing a discrete or continuous field. The default aggregation is used when you drag a measure to a view automatically. To change the default Aggregation Right-click on a measure menu option in the Data field and select Default Properties then select Aggregation, and then select one of the aggregation options.
How to Disaggregate the DataWhen you add a measure to your view, then Aggregation is applied to that measure automatically. This default is controlled by the Aggregate Measures setting in the Analysis menu. If you want to see all of the marks in the view at the most detailed level of the model, you can disaggregate the view. Disaggregating your data means that the Tableau will display a separate mark for every data value in every row of your data source. Disaggregation in all Measures in the viewClick on the analysis then go to aggregation measures option. When Aggregate Measures is selected, then automatically Tableau will attempt to aggregate measures in the view. Means that it collects individual row values from your data source into a single value that is adjusted to the level of detail in your view. The different aggregations available for measures determine how the individual values are collected: they can be averaged (AVG), added (SUM), or set to the minimum (MIN) or maximum (MAX) value from the individual row values. 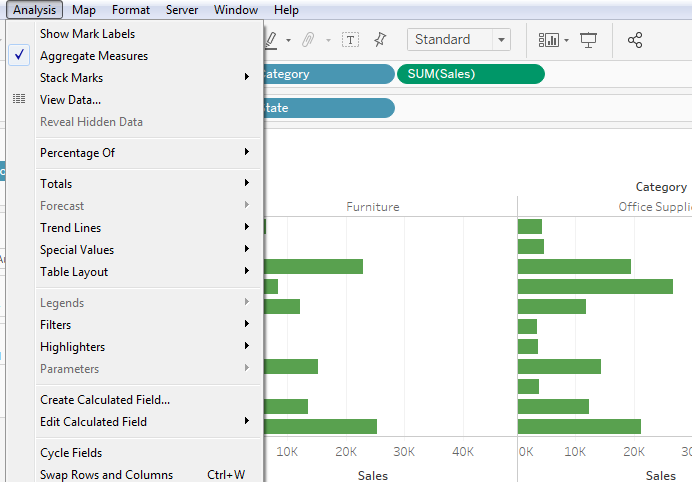
If it is already selected, click aggregation measures once for deselecting it. Then, you can see the changes. 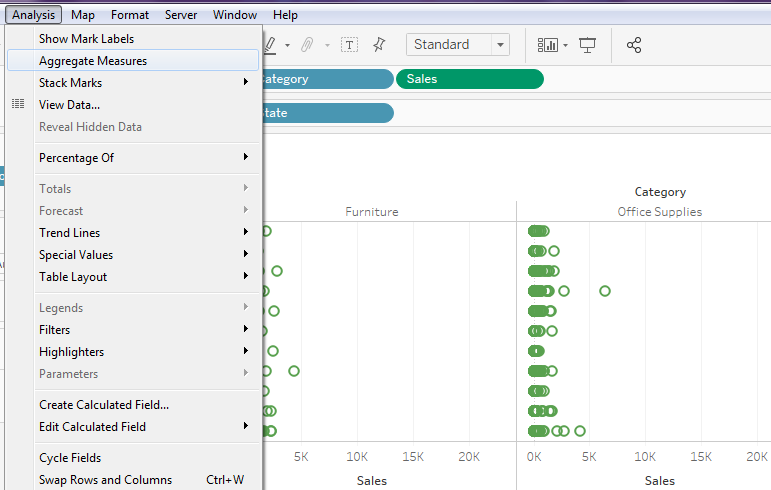
Disaggregating data can be useful for analyzing measures which you want to use both dependently and independently in the view. Note: If your data source is very large, then, as a result, disaggregating the data can degrade in significant performance.Aggregating DimensionsYou can aggregates dimension in the view as Maximum, Minimum, Count, and Count Distinct. When you aggregate a dimension, you have to create a new temporary measure column, so the dimension takes on the characteristics of a measure. 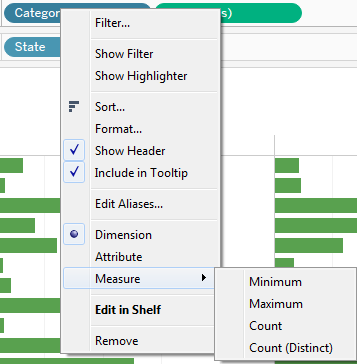
Note: The Count Distinct aggregation does not support the Text File and Microsoft Excel data sources using the inheritance connection. If you are connected to one of these types of data sources, then the Count Distinct aggregation is unavailable, and it shows the remark "Requires extract." If you save the data sources as an extract, you will be able to use the Count Distinct aggregation.Another way to view a dimension as an attribute. You can change it by choosing the Attribute from the context menu for the dimension. The attribute aggregation has several uses:
Tableau calculates the Attribute using the below given formula:
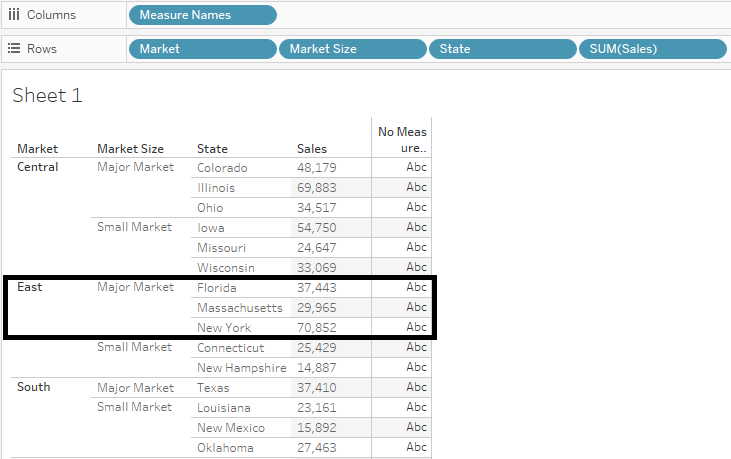
Above is an example of using Attribute in a table calculation. This table shows the market, market size, state, and sales by the market that is SUM (sales). Suppose, you want to compute the percent of the total sales according to each state contribution for the market. When you add some Percent of Total in table calculation that calculates along State, the calculation computes within the black area shown above figure just because the Market Size of dimension is partitioning the data. When you aggregate the Market Size as an Attribute, the calculation is computed within the Market (East), and the Market Size information is used as a label in the display. 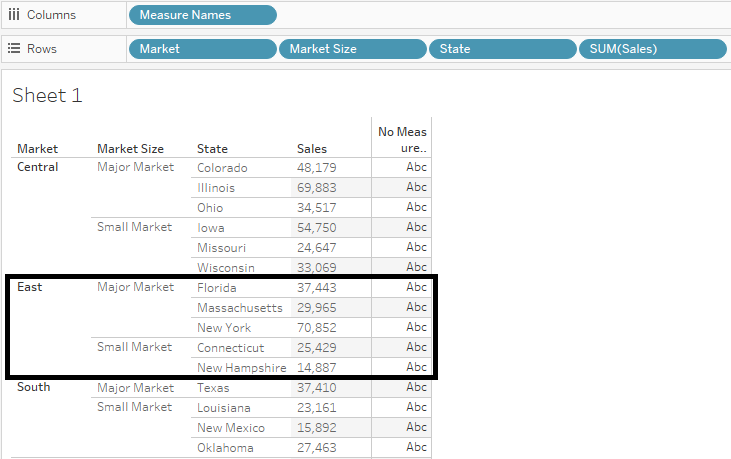
Next TopicTableau File Types
|
 For Videos Join Our Youtube Channel: Join Now
Feedback
- Send your Feedback to [email protected]
Help Others, Please Share


