| |

What is Data Cube?When data is grouped or combined in multidimensional matrices called Data Cubes. The data cube method has a few alternative names or a few variants, such as "Multidimensional databases," "materialized views," and "OLAP (On-Line Analytical Processing)." The general idea of this approach is to materialize certain expensive computations that are frequently inquired. For example, a relation with the schema sales (part, supplier, customer, and sale-price) can be materialized into a set of eight views as shown in fig, where psc indicates a view consisting of aggregate function value (such as total-sales) computed by grouping three attributes part, supplier, and customer, p indicates a view composed of the corresponding aggregate function values calculated by grouping part alone, etc. 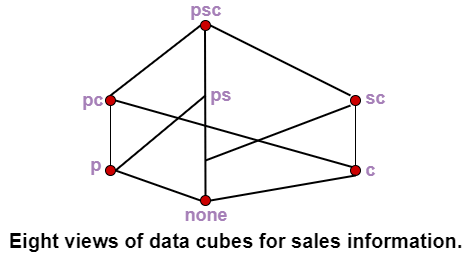
A data cube is created from a subset of attributes in the database. Specific attributes are chosen to be measure attributes, i.e., the attributes whose values are of interest. Another attributes are selected as dimensions or functional attributes. The measure attributes are aggregated according to the dimensions. For example, XYZ may create a sales data warehouse to keep records of the store's sales for the dimensions time, item, branch, and location. These dimensions enable the store to keep track of things like monthly sales of items, and the branches and locations at which the items were sold. Each dimension may have a table identify with it, known as a dimensional table, which describes the dimensions. For example, a dimension table for items may contain the attributes item_name, brand, and type. Data cube method is an interesting technique with many applications. Data cubes could be sparse in many cases because not every cell in each dimension may have corresponding data in the database. Techniques should be developed to handle sparse cubes efficiently. If a query contains constants at even lower levels than those provided in a data cube, it is not clear how to make the best use of the precomputed results stored in the data cube. The model view data in the form of a data cube. OLAP tools are based on the multidimensional data model. Data cubes usually model n-dimensional data. A data cube enables data to be modeled and viewed in multiple dimensions. A multidimensional data model is organized around a central theme, like sales and transactions. A fact table represents this theme. Facts are numerical measures. Thus, the fact table contains measure (such as Rs_sold) and keys to each of the related dimensional tables. Dimensions are a fact that defines a data cube. Facts are generally quantities, which are used for analyzing the relationship between dimensions. 
Example: In the 2-D representation, we will look at the All Electronics sales data for items sold per quarter in the city of Vancouver. The measured display in dollars sold (in thousands). 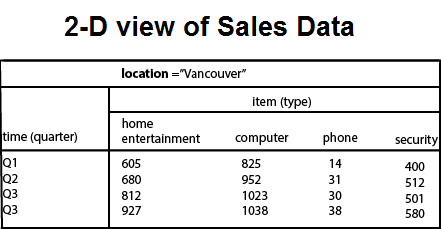
3-Dimensional CuboidsLet suppose we would like to view the sales data with a third dimension. For example, suppose we would like to view the data according to time, item as well as the location for the cities Chicago, New York, Toronto, and Vancouver. The measured display in dollars sold (in thousands). These 3-D data are shown in the table. The 3-D data of the table are represented as a series of 2-D tables. 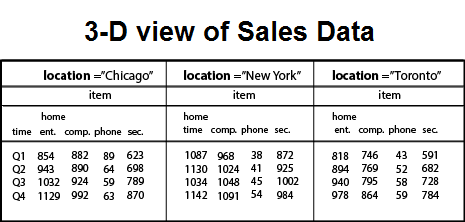
Conceptually, we may represent the same data in the form of 3-D data cubes, as shown in fig: 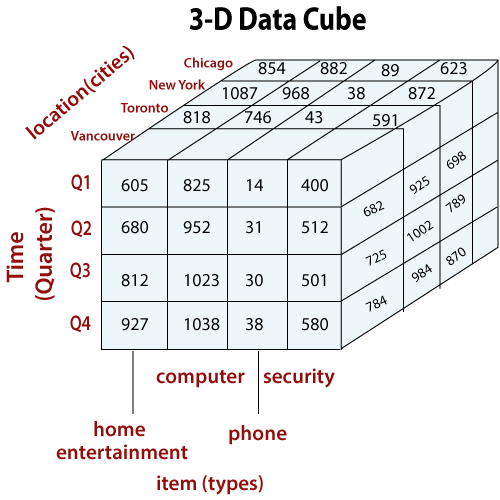
Let us suppose that we would like to view our sales data with an additional fourth dimension, such as a supplier. In data warehousing, the data cubes are n-dimensional. The cuboid which holds the lowest level of summarization is called a base cuboid. For example, the 4-D cuboid in the figure is the base cuboid for the given time, item, location, and supplier dimensions. 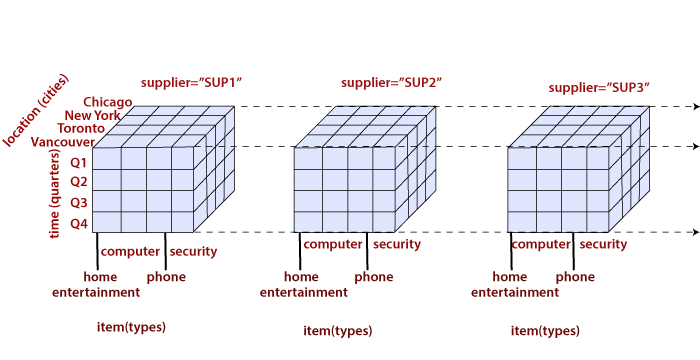
Figure is shown a 4-D data cube representation of sales data, according to the dimensions time, item, location, and supplier. The measure displayed is dollars sold (in thousands). The topmost 0-D cuboid, which holds the highest level of summarization, is known as the apex cuboid. In this example, this is the total sales, or dollars sold, summarized over all four dimensions. The lattice of cuboid forms a data cube. The figure shows the lattice of cuboids creating 4-D data cubes for the dimension time, item, location, and supplier. Each cuboid represents a different degree of summarization. 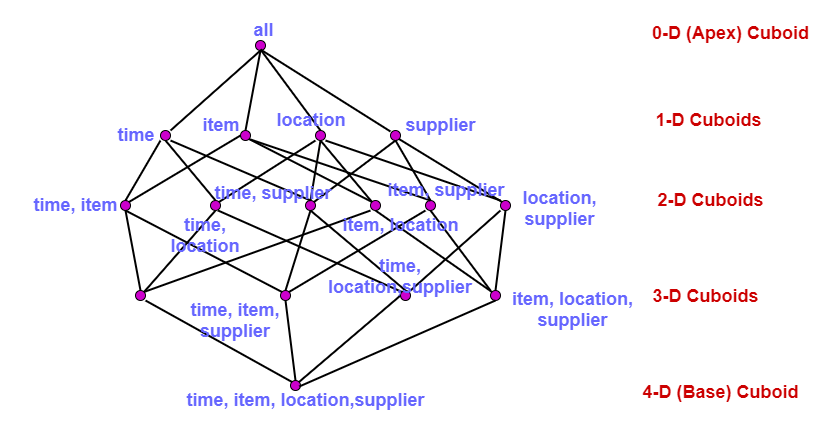
Next TopicWhat is Star Schema
|
 For Videos Join Our Youtube Channel: Join Now
Feedback
- Send your Feedback to [email protected]
Help Others, Please Share


