| |

Difference between Descriptive and Inferential StatisticsThe foundation of data analytics is statistics. It is the area of mathematics that enables us to identify patterns and trends in the vast majority of numerical data. Descriptive statistics and inferential statistics are two categories for statistical methods. In this article, we examine the distinctions between descriptive and inferential statistics and how they affect data analytics. It's interesting that while the goals may be different, certain measurement approaches are similar. So let's examine the main variations. 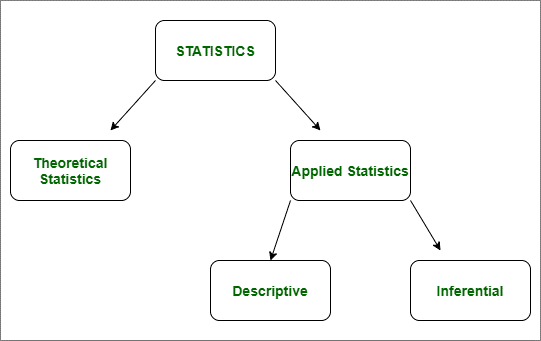
Descriptive StatisticsA descriptive statistic (in the count noun sense) is a summary statistic that numerically describes or summarises features from a collection of data, whereas a descriptive statistic (in the mass noun sense) is the use and analysis of those statistics. By focusing on summarising a sample rather than using the data to infer the demographic characteristics that the sample of data is supposed to represent, descriptive statistics differ from inferential statistics (or induction statistics). This essentially implies that descriptive statistics are typically nonparametric statistics and, unlike inferential statistics, are not constructed on the foundation of probability theory. 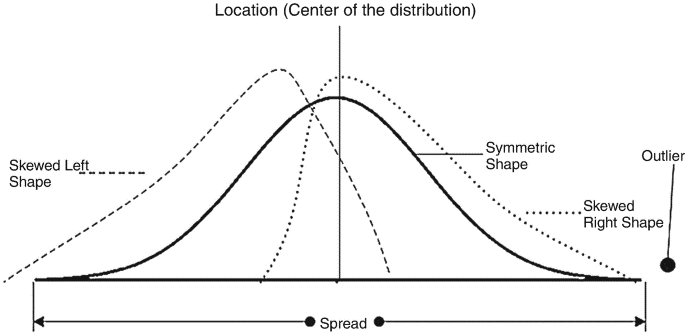
Even when inferential statistics are used to deduce the primary conclusions of data analysis, descriptive statistics are typically also provided. For instance, a table containing the overall sample group, sample sizes in significant subgroups (such as for each psychotherapy or exposure group), and population or clinical characteristics, such as the mean lifespan, the percentage of subject areas of the each sex, the percentage of subjects with linked co-morbidities, etc., is typically included in papers trying to report on human subjects. Central tendency indicators and measurements of variation or dispersion are two common metrics used to characterize a data set. While the standard error (or variance), the maximum and minimum values of a variables, kurtosis, and skewness are used as measurements of variability, the mean, median, and mode are used as indicators of central tendency. Descriptive statistics offer concise summaries of the sample and the findings that have been made. These summaries might be quantitative, like summary data, or visual, like easily readable graphics. These summaries may serve as the foundation for the initial overview of the information as part of a more in-depth data analysis, or they might be sufficient on their own for a certain investigation. A descriptive statistic that sums up a player's or team's performance is the shooting % in basketball, for instance. This figure is the sum of the quantity of shots fired and the quantity of shots taken. For instance, a player that shoots 33% makes around one out of every three shots. The percentage enumerates or characterises a number of distinct events. Think about your grade point average as well. A student's overall performance across all of their educational experiences is summarised by this one number. In fact, the basic tabulation of population and economic data was how the concept of statistics first originated. Descriptive and summary statistics have a long history of application. Box plots are one example of a summarization technique that has been categorised under the area of exploratory analysis of data more recently. Descriptive statistics offer a helpful summary of several types of data in the business sector. By undertaking empirical and analytical assessments on their assets, for instance, investors and brokers might utilise a historical document of return behaviour to make better investment selections in the future. Types of Descriptive statisticsThere are two types of descriptive statistics: measures of center tendency and measures of variability, commonly referred to as dispersion measures. Central TendencyMeasurements of variability concentrate on the dispersal of data, whereas measurements of central tendency concentrate on the mean or center values of data sets. To aid in understanding the significance of the studied data, these two measures make use of graphs, tables, and general remarks. The position of a distribution's center for a given data set is described by measures of central tendency. Each data item in the distribution is examined for frequency using the mode, mean, or median, that measures the predominant patterns of the studied data set. Measures of VariabilityMeasurements of variability, often known as spread measures, are tools for assessing how dispersed a collection of data's distribution is. For instance, while a person may be given the estimate of a data set by a measure of central tendency, the distribution of the data within the set is not indicated. Hence, even though the data's average may be 65 out of100, there may still be statistics between 1 and 100. By defining the layout and distribution of the data set, measures of variability assist in conveying this. Examples of variability measurements include range, upper quartile, absolute variance, and deviation. Inferential Statistics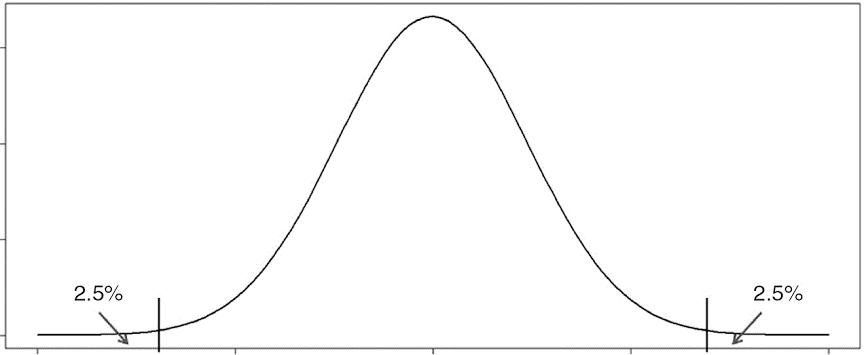
A subset of statistics called inferential statistics uses a variety of analytical techniques to infer information about the population from a sample of information. Descriptive statistics are another area of statistics in addition to inferential statistics. Descriptive statistics provide a summary of the characteristics of the data set, whereas inferential statistics aid in drawing conclusions about the population. Regression analysis and hypothesis testing are the two primary subtypes of inferential statistics. Inferential statistics requires that the samples used be representative of the population as a whole. By studying the samples derived from the population data, inferential statistics aids in the development of a solid understanding of the data. By utilising a variety of analytical techniques and tools, it aids in the creation of population-level generalisations. Many sampling procedures are employed in order to select random samples that accurately reflect the population. Simple random sampling, cluster sampling, stratified sampling, and purposeful sampling approaches are a few of the key methods. A statistician who utilizes analytical tools to infer details about a community by analyzing samples drawn at random is said to be working in inferential statistics. Making generalisations about a population is the aim of inferential statistics. When using inferential statistics, a statistic from the sample data is used (such as the sample mean) to draw conclusions about the sample statistic (e.g., the population mean). Since it allows for population conclusions without requiring the collection of all available data, inferential statistics are both extremely helpful and economical. The following are some instances of inferential statistics:
Types of Inferential StatisticsTests of hypotheses and regression analysis are two categories of inferential statistics. Confidence intervals can be used during hypothesis testing to check population parameters. A list of the various inferential statistics is provided below. Tests of HypothesesTesting hypotheses and drawing generalizations about the community from the sample data at hand are both examples of inferential statistics. Creating an invalid theory and a hypothesis test, then performing a statistics test of significance are required. The test statistic's value, the result is significant, and the confidence intervals are used to reach a conclusion. A hypothesis test can have left-, right-, or two-tailed distributions. Confidence IntervalA confidence interval is useful in determining a population's parameters. A 95% confidence interval, for instance, means that 95 out of 100 tests with fresh samples performed under identical conditions will result in the estimate falling within the specified range. The crucial value in testing hypotheses can also be determined using a confidence interval. In addition to these tests, the ANOVA test, Kendall did sign test, Mann-Whitney U test, Analysis of variance anova H test, etc. are other tests in use in inferential statistics? Regression AnalysisCalculating how one factor will change in relation to another one is done using regression analysis. There are numerous regression models that can be used, including simple linear, nonlinear regression, nominal, sigmoid, and ordinal regression. In inferential statistics, linear regression is the most often employed type of regression. The dependant variable's response to a unit change in the independent variable is examined through linear regression. Differences between Descriptive and Inferential Statistics
ConclusionBrief summaries of the sample and the results are provided via descriptive statistics. These summaries may be numerical, such as summarised data, or visual, such as comprehensible visuals. These summaries might be enough by themselves for a particular investigation, or they might serve as the basis for the first overview of the data as part of a deeper data analysis. Inferential statistics, a subset of statistics, infers knowledge about the population based on a collection of data using a number of analytical approaches. In addition toinferential statistics, there are additional types of statistics. The properties of the data set are summarised by descriptive statistics, whereas inferential statistics help infer inferences about the population.
Next TopicDifference between
|
 For Videos Join Our Youtube Channel: Join Now
Feedback
- Send your Feedback to [email protected]
Help Others, Please Share


