| |

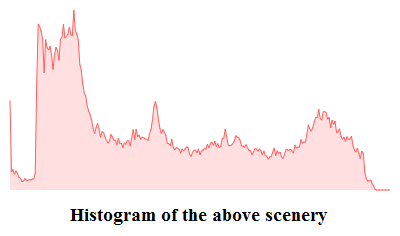
Histograms IntroductionIn digital image processing, the histogram is used for graphical representation of a digital image. A graph is a plot by the number of pixels for each tonal value. Nowadays, image histogram is present in digital cameras. Photographers use them to see the distribution of tones captured. In a graph, the horizontal axis of the graph is used to represent tonal variations whereas the vertical axis is used to represent the number of pixels in that particular pixel. Black and dark areas are represented in the left side of the horizontal axis, medium grey color is represented in the middle, and the vertical axis represents the size of the area. 
Applications of Histograms
Histogram Processing TechniquesHistogram SlidingIn Histogram sliding, the complete histogram is shifted towards rightwards or leftwards. When a histogram is shifted towards the right or left, clear changes are seen in the brightness of the image. The brightness of the image is defined by the intensity of light which is emitted by a particular light source. 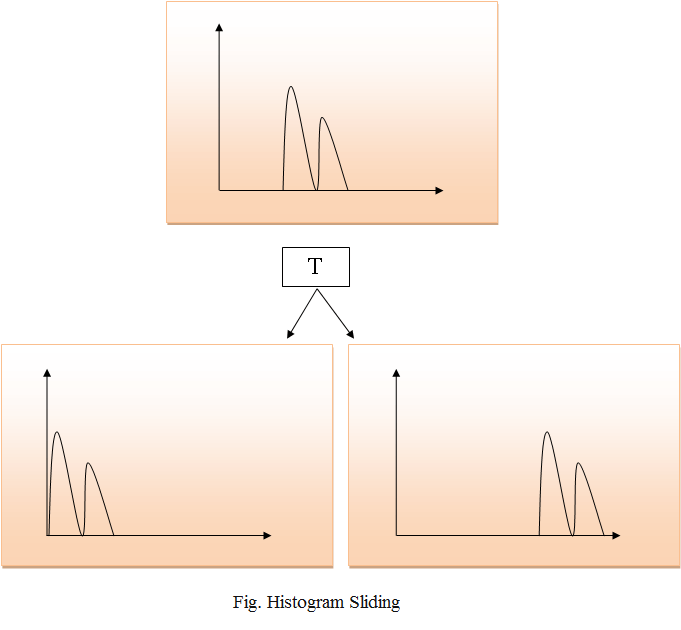
Histogram StretchingIn histogram stretching, contrast of an image is increased. The contrast of an image is defined between the maximum and minimum value of pixel intensity. If we want to increase the contrast of an image, histogram of that image will be fully stretched and covered the dynamic range of the histogram. From histogram of an image, we can check that the image has low or high contrast. 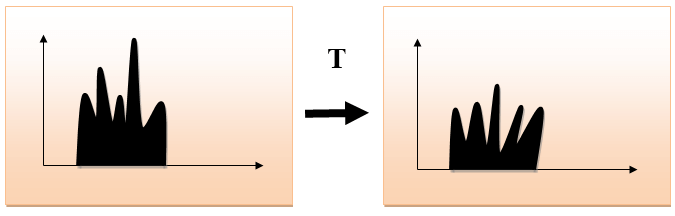
Histogram EqualizationHistogram equalization is used for equalizing all the pixel values of an image. Transformation is done in such a way that uniform flattened histogram is produced. Histogram equalization increases the dynamic range of pixel values and makes an equal count of pixels at each level which produces a flat histogram with high contrast image. While stretching histogram, the shape of histogram remains the same whereas in Histogram equalization, the shape of histogram changes and it generates only one image. 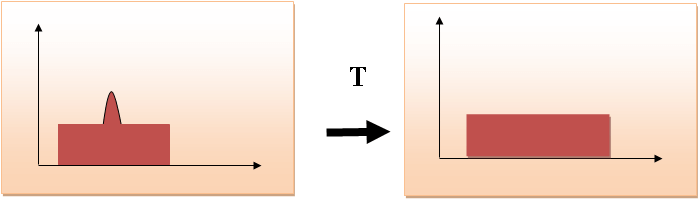
Next TopicBrightness and Contrast
|
 For Videos Join Our Youtube Channel: Join Now
Feedback
- Send your Feedback to [email protected]
Help Others, Please Share


