| |

Distributed tracing using ZipkinWhat is distributed tracing?Distributed tracing is a technique used to profile and monitor applications, especially those built using the microservice architecture. Distributed tracing, also called distributed request tracing. IT and DevOps teams can use distributed tracing to monitor applications. It identifies the failed microservices or the services having performance issues when there are many services call within a request. It is very useful when we need to track the request passing through the multiple microservices. It is also used for measuring the performance of the microservices. In the previous section, we have installed RabbitMQ that works as middleware. In this section, we will implement the Zipkin Server for Distributed Tracing. 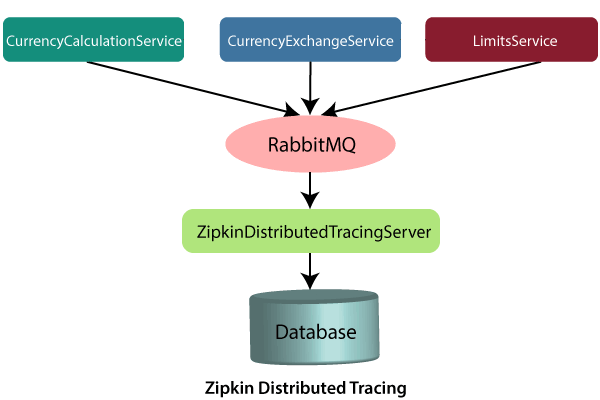
In the above figure, the ZipkinDistributedTracingServer connected to the in-memory database. All the microservices will put the messages in the RabbitMQ server. ZipkinDistributedTracingServer consumes the messages from the RabbitMQ server. In this section, we will focus on installing ZipkinDistributedTracingServer and will connect it with both the RabbitMQ server and the in-memory database. Let’s see how to connect the Zipkin server to other servers. Step 1: Download the Zipkin server. Search Zipkin quickstart on Google. Click on the link Quickstart OpenZipkin. We get the two options to quick start Zipkin, one is Docker, and the other is Java. But we will use the Java approach. Step 2: Download the zipkin-server-2.12.9-exec.jar file from https://search.maven.org/remote_content?g=io.zipkin&a=zipkinserver&v=LATEST&c=exec. Step 3: Copy the JAR file and paste it into any folder or drive. We have pasted the JAR file in the C drive directly. Step 4: Open the Command Prompt and run the following commands: The command launches the Zipkin server. 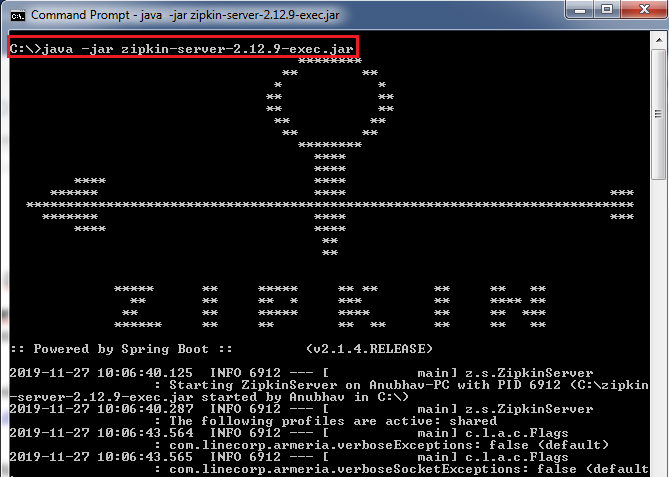
Let’s check the Zipkin server is running or not. Step 5: Open the browser and type http://localhost:9411/zipkin/. It shows the dashboard of the Zipkin server. Here, the port 9411 is the default port of the Zipkin server. 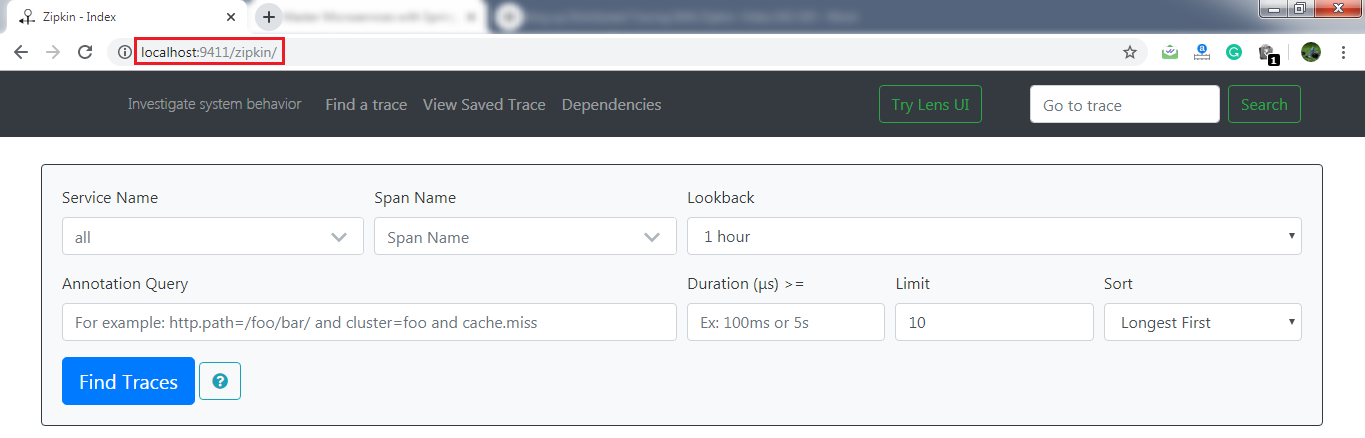
Here, the most important thing is that the Zipkin server must listen over the RabbitMQ server. So we have to start the RabbitMQ server in the background. Step 6: Kill the Zipkin server by pressing the keys Ctrl+c. Step 7: Run the following commands in the Command Prompt: The commands again start the Zipkin server along with the RabbitMQ server. 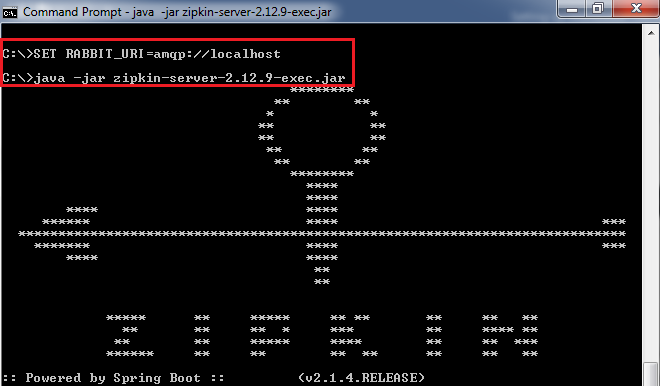
In this section, we have installed the Zipkin server. We have also started the RabbitMQ server and connect it to the Zipkin server. Now the Zipkin server is listening over the RabbitMQ server. But the microservices are not putting the trace messages in the RabbitMQ. In the next step, we will start putting the trace messages in the RabbitMQ.
Next TopicConnecting Microservices to Zipkin
|
 For Videos Join Our Youtube Channel: Join Now
Feedback
- Send your Feedback to [email protected]
Help Others, Please Share


