| |

Drawing Charts in D3.jsD3.js can be used to design any SVG chart statically. It can provide its support to design the charts listed below:
Let's consider the charts, as mentioned above, one by one in detail. Bar ChartThese charts are the most widely used charts among all the other charts. The bar charts are applied to compare and show the frequency, number, and other measures (like mean) for distinct, discrete groups or categories. These charts are designed in a form that the lengths and heights of the distinct bars will be proportional to any category's size they present. Some important key-points are as follows:
Drawing of Bar ChartsLet's design the bar chart with the help of the D3 in SVG. In the following-mentioned example, we will use the rect components for the text components and bars to show our values of data related to bars. Look at the following illustration of a bar chart: Example: Attributes width- SVG width scaleFactor- Scaled to the values of the pixel, i.e., visible on the screen. barHeight- It is the horizontal bar's static height. Output: The result of the above code will be as follows: 
Circle ChartsAny circle chart can be defined as the circular graphic statistically, which is categorized into slices for showing the numerical proportion. Drawing of Circle ChartLet's make the circle chart with the help of D3 in SVG. The example of drawing a circle chart is depicted below: Example: In the following illustration- Attributes- width- SVG width height- SVG height data- Data element's array colors- Apply colors on the circle items. Some other attributes- Var g= svg.selectAll("g")- Creates the group items to hold a circle. .data(data)- Binds our array of data to any group item. .enter()- Creates the placeholders to our group items. .append("g")- Appends the group items for our page. Output: The output will be as follows- 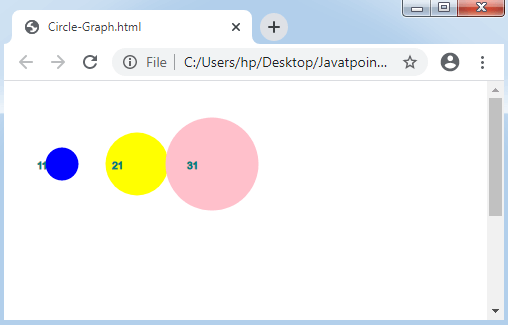
Pie ChartThe pie charts are the circular graphic that is designed statistically. These are categorized into some slices to display numerical proportions. Let's learn how to design the pie chart using D3. Drawing of Pie ChartFirst of all, we have to learn two of the essential methods which are listed below:
Let's discuss the above two methods in more detail. d3.arc: This method produces an arc. We need to fix an internal radius and also an external radius for the arc. When the internal radius contains 0, then the outcome will be the pie chart, the outcome will be the donut chart. d3.pie: The second method, d3.pie, produces the pie chart. The d3.pie method holds the data from the dataset and determines the start and end-angle for all the pie chart's wedge. Example: The following is an example to display a basic pie chart. Have a look: Output: The output is as follows: 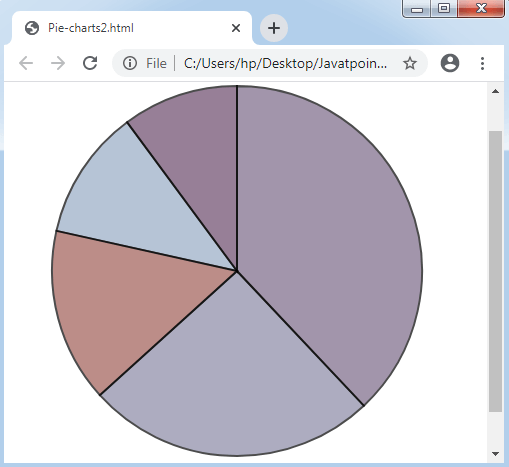
Next TopicCollection API in D3.js
|
 For Videos Join Our Youtube Channel: Join Now
Feedback
- Send your Feedback to [email protected]
Help Others, Please Share


