| |

ER Diagram for Student Management SystemIn DBMS, ER diagram for a student management system shows how the databases are connected to each other. It also shows how all the databases are logically related to each other. We can also create an ER diagram by drawing the figure of a different part of the student management system, their properties, and how they perform their task. We can draw an ER diagram of the student management system by drawing the design of the database. The sketch of the database became the storage of the database where the data comes and goes. Before explaining the ER diagram of the student management system, the following labels are used. These are as follows.
Details Student Management System ER DiagramNow we describe the overall function of the Student Management System in the below table. It is a complete overview of the information about the student management project.
What is a Student Management System?The student management system is a type of solution tool that provides the facility to track, maintain and manage the data generated by the school, including the grade, attendance, and interpersonal record of the student. What is an ER Diagram?We can also call ER diagram the database design for the student management system project. The ER diagram is like a picture that contains how all the entities are related to each other. The most important part of the ER diagram is Relationships, Attributes, and Entities. Importance of ER DiagramThe ER diagram for the project is the foundation for the building of the database of the project. The properties, datatypes, and attributes are defined by the ER diagram. ER Diagram for Student Management SystemThe ER diagram for the Student management system, the system data, and their attributes. The data and the attributes are represented by the table, and the table shows how they are related to each other. Database Design for the Student Management System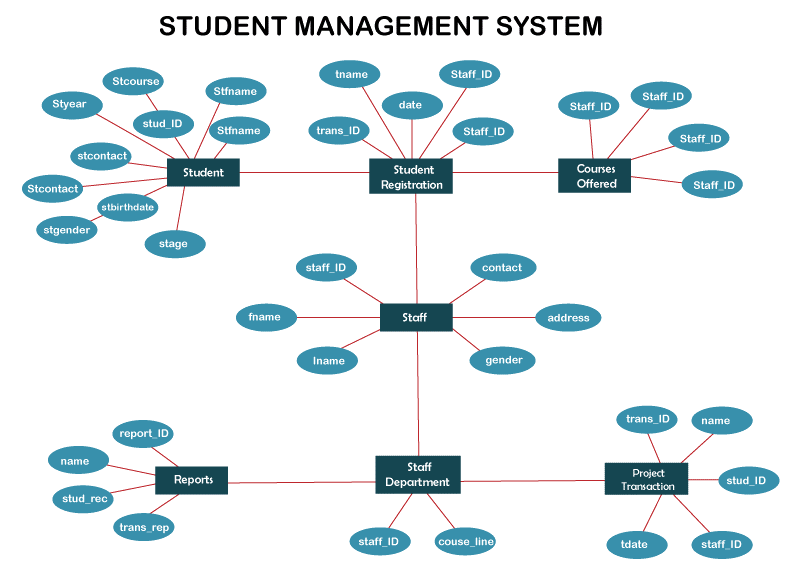
The above diagram shows the database design for the student management system. This database design shows all the system data, and the output for the user ate stored in the database. In DBMS, a good ER diagram is needed for the creation of a student management system. Student Management System ER Diagram TablesThe table below shows all about the table's field name, description, data type, and character length. Each table of the ER diagram defines and explains the data storage. The field column lists all the database attributes that describe each column. The types table of the database shows what kind of data each attribute is, and the length shows how many characters it has. Table Name: tblStudent
Table Name: tblCourse
Table Name: tblStaff
Table Name: tblStaff_Department
Table Name: tblProject_Transaction
Table Name: tblStudent_Registration
Table Name: tblStudent_Reports
With the help of the above tables, we can set up the database for the student management system. It provides the full description of the database with its table names. They will enter all the values and attributes for the database in the table. How to create ER DiagramWe can create the ER diagram for the table just in 5 minutes. There are some steps, and with the help of these steps, we can build the ER diagram for the student management system project. The steps are as below. Step 1: We have to familiarize ourselves with the entity relationship diagram cardinality and symbols. Then we have to show the data structure for the project in the entity relationship diagram. The symbol of the entity relationship diagram shows how they fit together. Before making the ER diagram, we should properly know the meaning of all the symbols and how to use all of them symbols. Symbol of entity relationship diagram:-
Step 2: Finalize the entities included Start making your ER Diagram by deciding on all the parts your student management system must have. You'll need to leave the area in your design for these rectangles to be included later. Step 3: Add the attributes of each entity After you've decided on the entities, think about the traits you'll need for each one. In a conceptual ER diagram, the details of the different entities are given as attributes. Attributes are things like a thing's traits, a many-to-many relationship or a one-to-one relationship. Attributes with multiple values can be given more than one value. Step 4: Describe the relationships (cardinality) between entities and attributes You will need the entities, their attributes, and the relationships between them in order to plot the relationships between the ERD. To get the right entity relationship diagram, you will use the information you gathered to build the data structure. ConclusionYou need to know how the Student Management System was designed and built using diagrams. With the help of an ER diagram will help you make a system that works well. Making it will help you understand how the software works behind the scenes. This is where all the data that goes in and out of the system will be stored. |
 For Videos Join Our Youtube Channel: Join Now
Feedback
- Send your Feedback to [email protected]
Help Others, Please Share


