| |

Graphing Functions in Discrete mathematicsGraphing function can be described as a process of drawing the graph of a function. There are some simple functions and some complex functions in the basic graphing functions. The simple functions are cubic, linear, quadratic, and many more and the complex functions are logarithmic, rational, etc. In this section, we will understand the definition, basic functions, and examples of graphing functions. Use of Graphing functionsWith the help of a graphical function, we can draw a curve that is used to indicate the function on a coordinate plane. If this curve (graph) indicates a function, then each and every point on the curve will equally satisfy the function. For example: In this graph, we will show the linear function f(x) = -x+2. 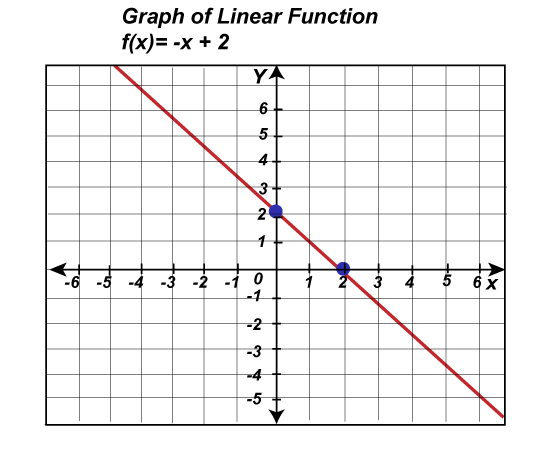
Now we can take any point on the line from the above graph. Here we will take (-1, 3). Now we will substitute (-1, 3) = (x, y) in the function f(x) = -x+2. That means for this function, x = -1, and y = 3. We can also write the function f(x) = -x+2 in the form y = -x+2. Now we will put the values of x and y in the function y = -x+2 and get the following: 3 = -(-1)+2 3 = 1+2 3 = 3 Hence, we can say that the point (-1, 3) satisfies the function. Similarly, we can take different points from the above line and check whether those points satisfy the function. In this case, the function will be satisfied by every point on the line/curve. The process of drawing these types of curves, which represent the functions, is known as graphing functions. Graphing Basic functionThere are a lot of basic graphic functions that are very easy, i.e., quadratic functions and linear functions. Some basic ideas of graphical functions are described as follows:
Now we will understand some examples of graphing basis functions with the help of graphical linear functions, Graphical quadratic functions, and Graphical complex functions. Graphical Linear FunctionsWe have already drawn a graph for a linear function with the form f(x) = ax+b. Here we will also take the same linear form. Here we will create a table with some random values of x. So we will take some values like x = 0 and x = 1, and then we will find the value of y by putting each of the values of x in y = -x+2. After putting the values, we will get the following:
So from the above, we get two points on the line that is (0, 2) and (1, 1). If we plot any of the one points on a graph and join these points with the help of a straight line (extending the line on both sides), then the graph will be the same as shown above. Graphical Quadratic functionsIn this function, we can also determine some random points on it. With the help of these random values, we may not get a perfect U-shaped curve because if we want to get a perfect U-shaped curve, then we have to know about the point where the curve is turning. That means for a perfect U-shaped curve, we have to find its vertex. When we successfully find the vertex, we identify two or three random points on each side of the vertex. These random points will help us to draw the graph of a function. Example: In this example, we have to draw a graph of the quadratic function, which has a line f(x) = x2 - 2x + 5. Solution: First, we will compare f(x) = x2-2x+5 with f(x) = ax2+bx+c, and then we will get a = 1, b = -2, and c = 5. Now we will get the coordinate of x axis and y axis with the help of these values. The x coordinates of vertex will be h = -b /2a = -(-2) /2(1) = 1. The y coordinates of the vertex will be f(1) = 12 - 2(1) + 5 = 4. Hence, the x and y coordinates of the vertex will be (1, 4). Now we will create a table by taking two random numbers of x on each side of 1. Then we will use the above function y = x2-2x+5, and find the y coordinates.
With the help of above table, the plots will be (-1, 8), (0, 5), (1, 4), (2, 5), and (3, 8). Now we will join all the points on the graph sheet and extend the curve on both sides like this: 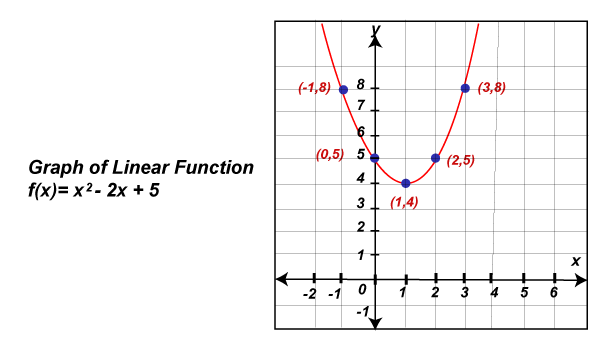
Graphical Complex FunctionsThe graphing function will be known as the simplest function if each of their range and domain is a set of real numbers. This case is not compulsory for all types of functions. There can be complex functions for which we have to take care about the range, domain, holes, and asymptotes at the time of drawing them. The most popular those types of functions are described as follows:
Now we will show the graph of each of the function's parent functions separately like this: 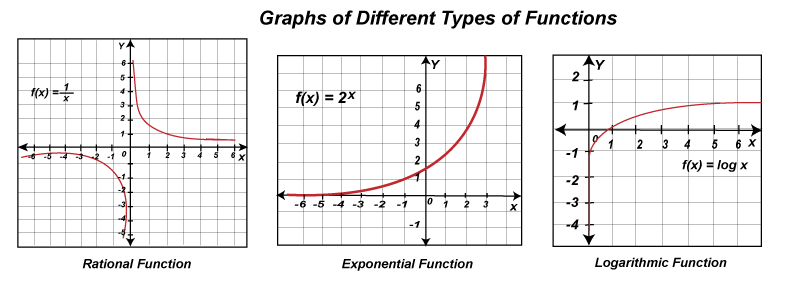
We have to follow the following steps in each of these cases for graphing functions:
We will use the Graphical rational functions, Graphical exponential functions, and Graphical logarithmic functions to understand the graph of a function in different cases with the help of above steps. Graphing Rational functionsHere we will graph a rational function f(x) = (x+1) /(x-2) with the help of above steps like this:
Now we will plot all the above points along with Horizontal asymptote (HA) and vertical asymptote (VA) in the following way: 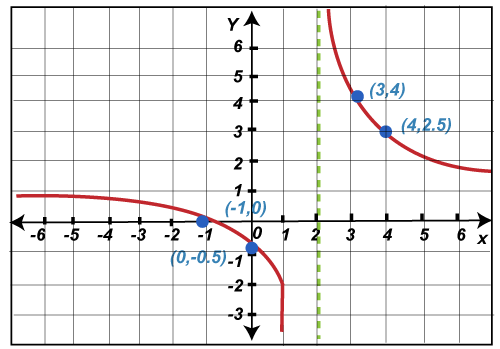
Graphing Exponential FunctionsHere we will assume an exponential function f(x) = 2-x + 2. With the help of steps described in the Graphical complex functions, we will graph this function like this:
Now we will plot all the above information on a graph in the following way: 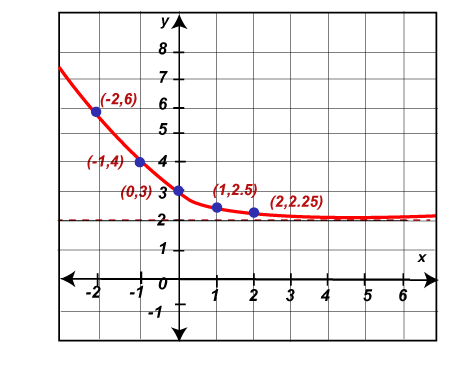
Graphical Logarithmic FunctionsHere we will assume a logarithmic function f(x) = 2 log2 x-2. With the help of steps described in the Graphical complex functions, we will graph this function like this:
Here we have chosen those types of x's values that are able to simplify the value of y easily. Now we will plot all the above information on a graph in the following way: 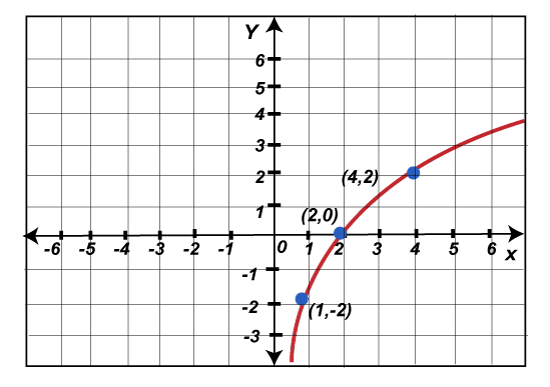
Graphing Functions by TransformationsWe can graph the functions with the help of applying transformations on the graph of parent functions. Here we will show some parents functions of some important functions like this: Linear function: Its parent function is: f(x) = x Quadratic function: Its parent functions is: f(x) = x2 Cubic function: Its parent functions is: f(x) = x3 Absolute Value function: Its parent function is: f(x) = |x| Reciprocal function: Its parent function is: f(x) = 1/x Logarithm function: Its parent function is: f(x) = log x Square root function: Its parent function is: √x Cube root function: Its parent function is: ∛x Exponential function: f(x) = ax, 0<a<1 We should keep in mind the look of the graph of all above-described parent functions. After that, we will be able to apply the transformation to the graph of given function.
Important Notes on Graphing Functions
|
 For Videos Join Our Youtube Channel: Join Now
Feedback
- Send your Feedback to [email protected]
Help Others, Please Share


