| |

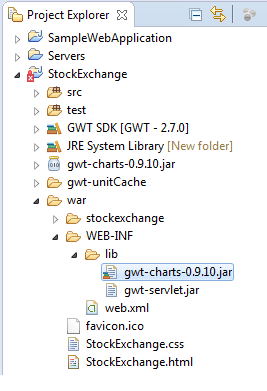
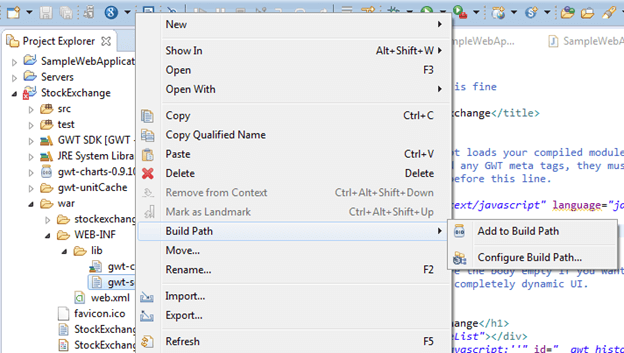
GWT ChartsGWT does not contain pre installed repository for creation of charts. We can download its repository from maven repository. In gwt, charts are created through gwt chart tools also known as Google Visualization. To setup the GWT Charts, we follow following steps:
List of GWT Charts:
GWT Chart ExampleIn this code, we implement the Area chart where area is shown according to the coffee production order. Output: 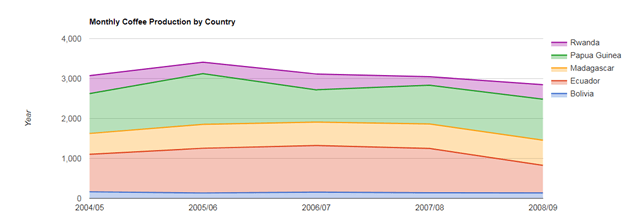
GWT Charts ControlsGWT charts have control features which enables chart creation to be in different control regions. Here are the few controls:
GWT Chart ExampleBelow code is of the Chart Range Filter: Output: 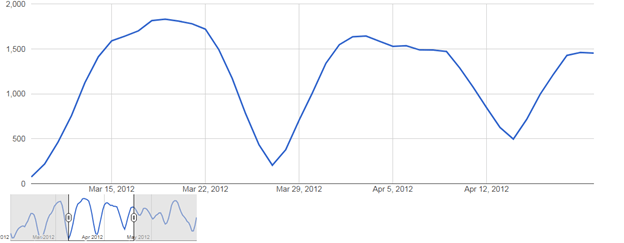
Next TopicGWT Database
|
 For Videos Join Our Youtube Channel: Join Now
Feedback
- Send your Feedback to [email protected]
Help Others, Please Share


Like/Subscribe us for latest updates or newsletter 


