| |

How to Find Standard DeviationThe standard deviation is the most important and widely used measure of studying variation (dispersion). It shows the variation in data. The calculation of the standard deviation is a bit complicated. The risk of making a mistake is high, so we need high attention and accurate calculation. In this section, we will learn how to find the standard deviation. Standard Deviation DefinitionsThe standard deviation (SD) is a quantification that measures the distribution (dispersion) of the data set relative to its mean. It is calculated as the square root of the variance. It is denoted by the lower Greek letter σ (sigma). If the deviation is greater, the dispersion will be greater, and if the deviation is lesser greater the uniformity. Some other definitions are:
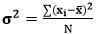
VarianceIt defines how much a random variable differs from its expected value. It is the average of the squares of the differences between expected and individual value. It can never have a negative value. It is denoted by σ2. The formula of variance is: 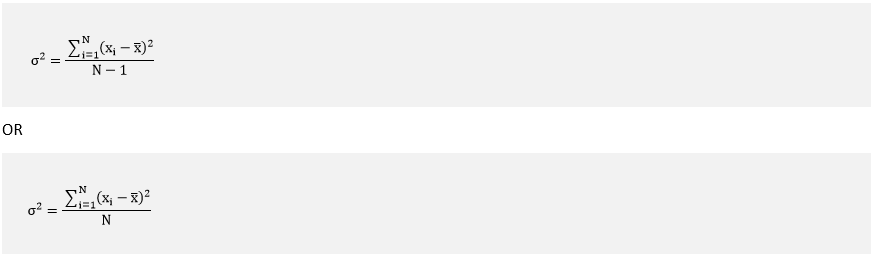
How to Find Standard DeviationIt is calculated as the square root of variance by determining the variations between each data point relative to the mean. The higher the standard deviation, the higher the variance between each data set, and the mean. The formula of Standard DeviationThere are two formulas to calculate the standard deviation. Both formulas measure the variations. But there is a difference between them.
Population Standard DeviationIt is a parameter that calculates a fixed value from every individual in the population. The formula of population standard deviation is: 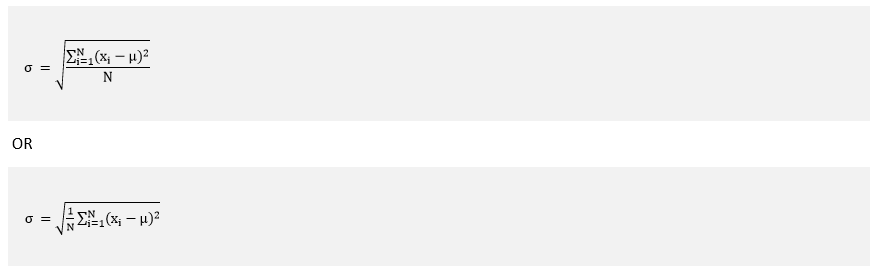
Where: σ: Population standard deviation. xi: Each element in the data set. Where i = 1, 2, 3, ...., N.μ: Mean of all elements in the data set. N: The number of elements. Sample Standard DeviationIt is a statistic. In this standard deviation, only some individuals from the population are taken for the calculation. It has greater variability because it depends on the sample. Hence, the standard deviation of the sample is greater than the population standard deviation. The formula of sample standard deviation is: 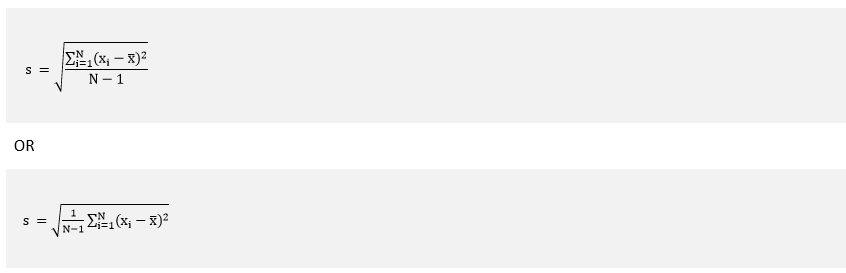
Where: s: Sample standard deviation. xi: Each element in the data set. Where i = 1, 2, 3, ...., N. x: Mean of all elements in the data set. N: The number of elements. Now, we will see how these standard deviations are different from each other. Consider the sample and population standard deviation formula; we see that both the formulas are nearly identical. Step 1: First, calculate the mean. Sum up all the values and divide by the number of elements. Step 2: Calculate the deviation from the mean. To achieve the same, subtract the mean from each value. Step 3: Square the deviations. Step 4: Square the deviations and add them. Step 5: Divide the squared deviation by the number of observations. This step has a major difference between population standard deviation and sample standard deviation.
Step 6: Find the square root of the quotient that we get in the above step. The values of population and sample standard deviation depend on N. The larger the value of N, the greater the population, and sample standard deviation. Properties of Standard Deviation
Uses of Standard Deviation
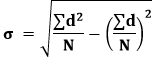
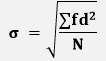
Methods of Standard DeviationsDirect MethodWe can also find the standard deviation by using the direct method. It is used when the deviation is taken from the actual mean. The formula for the direct method is: 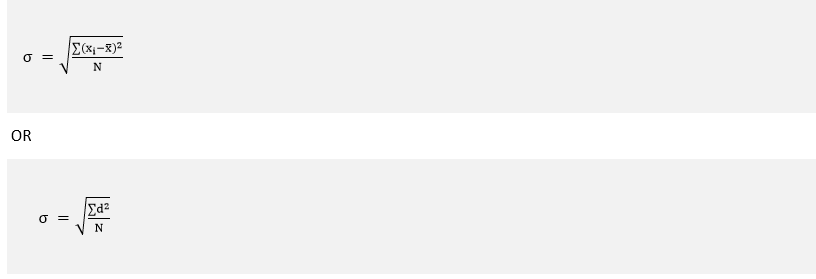
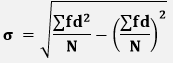
Where: d=(xi-x) σ: Standard deviation xi: Each element in the data set. Where i = 1, 2, 3, ...., N. x: Mean of all elements in the data set. N: The number of elements. Assumed Mean MethodIn this method, we do not calculate the actual mean. Instead of this, we choose a random value to calculate the deviation. The assumed value must lie around the middle value. It is also known as the shortcut method. The formula for the assumed mean method is: 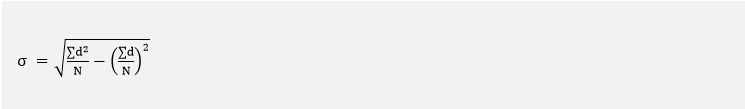
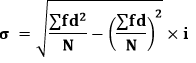
Where, f: Corresponding frequency d=x-A (A is assumed mean) N: The number of elements in the data set. Step Deviation MethodIt is an extended form of the shortcut method. It simplifies the calculation. The formula for the assumed mean method is: 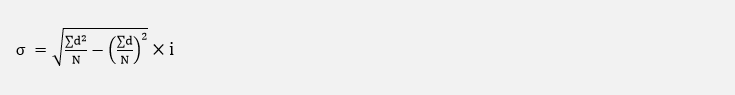
Where, f: Corresponding frequency d= N: The number of elements in the data set. i: Common class interval Types of DistributionsBefore moving to the examples, we must know about the three types of distribution.
Example of Individual SeriesExample: Find the standard deviation of the following data using direct and assumed mean method.
Solution: Using the Direct Method First, we will calculate the mean. 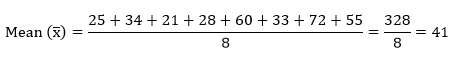
Now, we will calculate the variance (σ2). The formula for variance is:
Putting the values in the variance formula, we get: 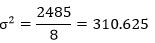
The formula for standard deviation is: σ =√σ2 σ =√310.625=17.624 Using Assumed Mean or Short-cut Method We know the formula of the assumed mean method for individual series: 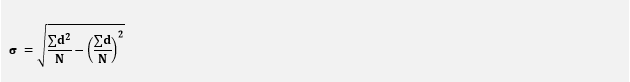
In the above formula, d=x-A. Where A is assumed mean. So, let's assume A = 38.
Putting the values in the above formula, we get: 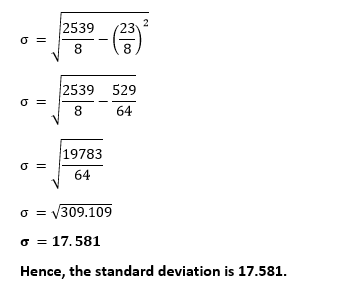
Example of Discrete SeriesExample: Find the standard deviation of the data given below using the direct and shortcut method.
Solution: Using the Direct Method First, we will calculate the mean. 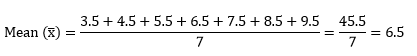
We know the formula of a direct method for discrete series: 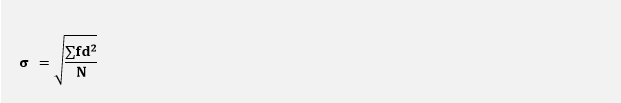
Putting the values in the formula, we get: 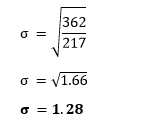
Using the Short-cut Method We know the formula of the shortcut method for discrete series: 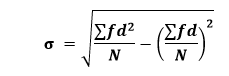
In the above formula, d=x-A. Where A is assumed mean. So, let's assume A = 6.5.
Putting the values in the formula, we get: 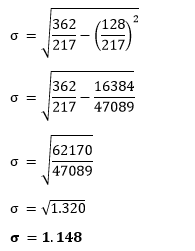
Hence, the standard deviation is 1.148. Example of Frequency Distribution (Grouped Data or Continuous Series)Example: Calculate the standard deviation of the data given below using the direct and shortcut method.
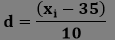
Solution: Using Step Deviation Method We know the formula of step deviation method for continuous series: 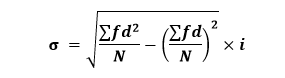
In the above formula,
Putting the values in the formula, we get: 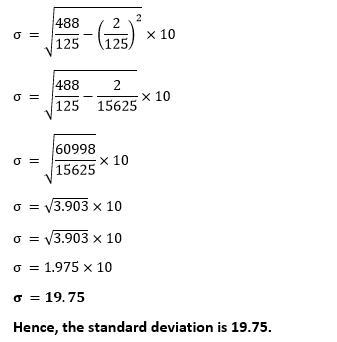
Example of Population Standard DeviationExample: Find the standard deviation using the population standard deviation. 12, 2, 45, 23, 55, 8, 11, 19, 57, 3 Solution: In the above question, the marks of ten students are given. The question says that apply the sample standard deviation. In this case, we will not take all student's marks for calculation. We will take a few student's marks for calculation as a sample. We have taken only six marks for calculation are as follows: 12, 45, 23, 11, 19, 3 We know the formula of sample standard deviation: 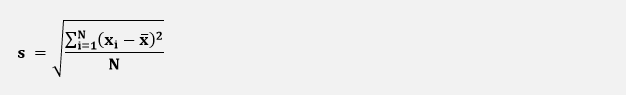
Now, we will find the values used in the formula. Step 1: Calculate the sample mean (x). 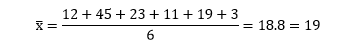
Step 2: For each data element, subtract the mean and square the result.
Step 3: Divide the ∑(xi-x)2 by the N-1. Here, a total of 6 elements are there, so dividing the sum by 6-1=5, we get: 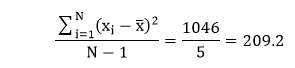
Step 4: Take the square root of the above result. s =√209.2=14.46 Hence, the sample standard deviation is 14.46. Example of Sample Standard DeviationExample: Find the standard deviation using the population standard deviation. 12, 2, 45, 23, 55, 8, 11, 19, 57, 3 Solution: In the above question, the marks of ten students are given. The question says that apply the population standard deviation. In this case, we will take all student's marks for calculation. We know the formula of sample standard deviation: 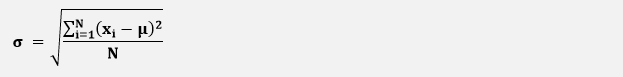
Now, we will find the values used in the formula. Step 1: Calculate the population mean (μ). 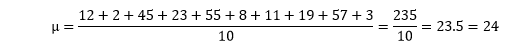
Step 2: For each data element, subtract the mean and square the result.
Step 3: Divide the ∑(xi-μ)2 by N. Here, a total of 10 elements are there, so dividing the sum by 10, we get: 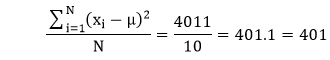
Step 4: Take the square root of the above result. σ =√401=20.02=20 Hence, the population standard deviation is 20.
Next TopicDecimal to Fraction
| |||||||||||||||||||||||||||||||||||||||||||||||||||||||||||||||||||||||||||||||||||||||||||||||||||||||||||||||||||||||||||||||||||||||||||||||||||||||||||||||||||||||||||||||||||||||||||||||||||||||||||||||||||||||||||||||||||||||||||||||||||||||||||||||||||||||||||||||||||||||||||||||||||||||||||||||||||||||||||||||||||||||||||||||||||||||||||||||||||||||||||||||||||||||||||||||||||||||||||||||||
 (A is assumed mean)
 . Where A is assumed mean. So, first, we will calculate the mean (m). In the following table, we have calculated the mean of each class interval. Among them, we have assumed a mean that is 35.
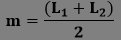
 For Videos Join Our Youtube Channel: Join Now
Feedback
- Send your Feedback to [email protected]
Help Others, Please Share


