| |

How to Group Columns in Microsoft Excel?What do you mean by the term Grouping Columns in Microsoft Excel?It is well known that sometimes particular worksheets usually contain complex data that is considered to be very difficult for the purpose of reading as well as analyzing it in order to accessing it and effectively reading these types of data and the Grouping of the cells will also help us to perform the above. Grouping of the columns or the rows is primarily used if we want to group out the items visually or monitor them in a concise and organized manner just under a single heading or if we want to hide or show out the data for better display and its presentation as well. Moreover, Grouping is a very simple as well as the useful method in accounting and finance spreadsheets. Now just under the 'Data Tab' which is present in the Ribbon, we can easily find out the Group option in the outline section efficiently. Group Columns in Microsoft Excel: It means that bringing of one or more columns together in an Excel worksheet, as it will be enabling an option in order to contract or expand the respective selected column; also the Microsoft Excel provides a button to achieve this without facing any kind of difficulties. And for the purpose of Grouping the columns in the sheet, we need to select two or more columns. What shortcuts keys are used for Grouping columns or Rows in Microsoft Excel? The various shortcut keys that are primarily available for Grouping of the column or the rows in Microsoft Excel are as follows:
How can one enable the Grouping of Columns in Microsoft Excel?Now in this, we will be checking out how one can easily group columns and How to collapse as well as expanding out the respective columns just after grouping out all the columns in Microsoft Excel respectively. # Example 1: Grouping of the columns in Microsoft Excel The Grouping of the selected columns in Microsoft Excel usually works well for the various structured data where it needs to contain out the column headings. It should have manageable column or the row data efficiently. Moreover, we initially needed this to select the columns we required to group effectively: C, D, and E columns. Step 1: First, we need to go to the Data tab, and then we will be clicking on the respective group options, which are present just under the outline section. Step 2: After that, we need to click on the respective selected columns, and then we will press the "OK" button to proceed further. Now just after performing the above mentioned steps, we can observe that in the given set of data, the columns are grouped perfectly, and the outline bars can be easily observed just at the top, representing the different levels of the data organization respectively. Moreover, the Grouping also introduces a toggle option, or it will be creating a hierarchy of the groups, that are termed to be an outline, that primarily helps our worksheet to get appear in an organized manner in which every bar represents a level of the organization. How to collapse and Expand Columns after Column Grouping in Microsoft Excel? We can easily press out the "-" buttons in the given margin in order to collapse the columns (A, B, C, D, and E columns completely disappears), or in case we want to expand them again, pressing out the "+" buttons in the given margin that are: B, C, D columns that appears. And the other way that can be used for the purpose of accessing the data is by making use of the option that is: option 1 or option 2, which are basically present on the left side of the selected worksheet, which means it is called state, 1st option is effectively known as the hidden state (if we click on it, then it will hiding the Columns such as B, C,D and so on) while the 2nd option is known to be an unhidden state as it will be responsible for expanding those hidden columns, which are none other than B, C, D, and E Columns. 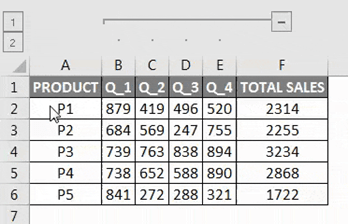
How can one easily Ungroup Columns in Microsoft Excel? For ungrouping columns in Microsoft Excel, we need to perform the below-mentioned steps effectively: Step 1: First, we will be selecting the columns we wish to ungroup (the columns we have previously grouped out). Now on the Data tab present under the in the Outline group, we will also be clicking on the ungroup command as well: 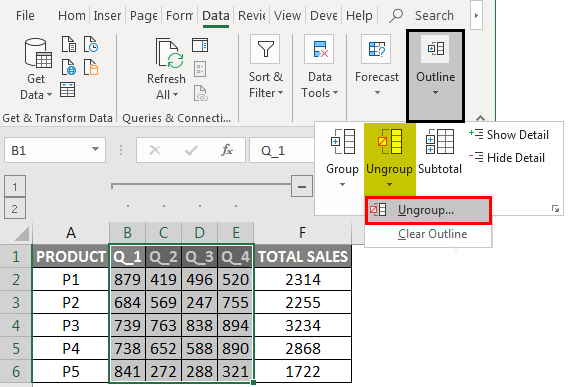
Step 2: Next, we will click on the respective columns and then press the OK button. 
After performing all the steps mentioned above, we can easily observe data bars & "+" buttons and "-" buttons disappear in the excel sheet once the ungroup option is selected. 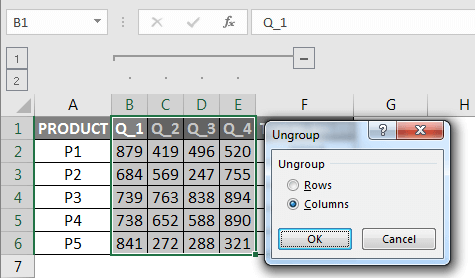
#Example 2: Multiple Grouping of Columns for Sales Data in Microsoft Excel Now for the below-mentioned example, the respective Table usually contains product monthly sales data starting from January to December, and it is also represented in quarterly as well as in the yearly sales. Here the data is in the structured form and will contains no blank cells, hidden rows, or the hidden columns as well. 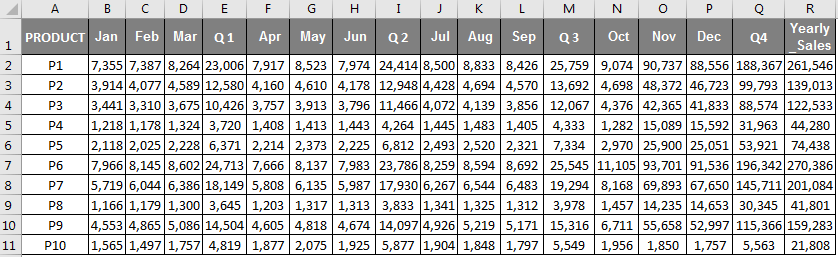
And we want only some of the monthly sales data to be getting displayed, and also displaying the data in the format of quarterly sale and yearly sale so this could be achieved through multiple grouping of column options efficiently. Initially, we need this for selecting the particular column we want to group it; now, let us select the months (that means: Jan, Feb, and Mar columns).Then, we will be moving to the Data tab that is present in the Home ribbon, and it will be opening a toolbar just below the Ribbon, and after that we will be clicking on the group option, that can be seen under the outline section; now we can observe in a data, that the columns are grouped perfectly as we want. 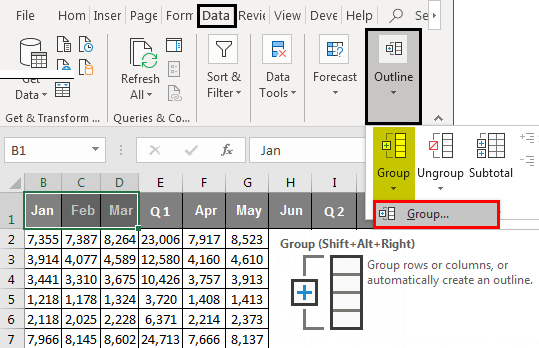
After that, we will click on the columns and then pressing on the OK button. 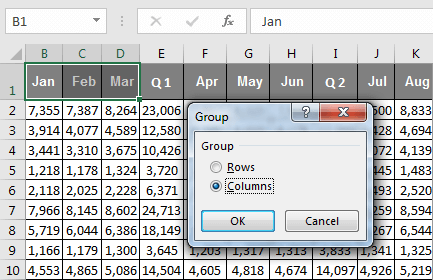
And we can see that a similar procedure is applied for Apr, May, Jun, Jul, Aug, Sep, and Oct, Nov, Dec columns as well. 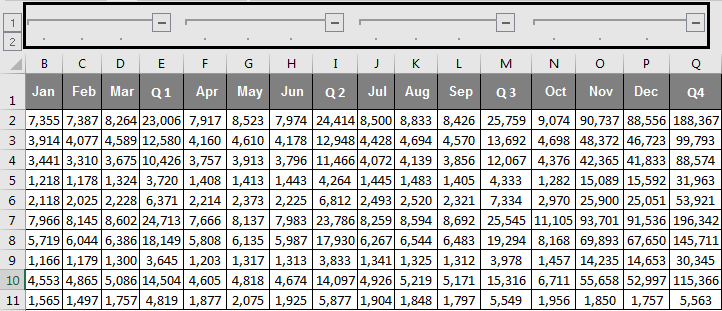
Once we are done with the grouping of the above mentioned monthly columns, we can observe that the columns are grouped according to our need in a given dataset. And the four outline bars that we can observe at the top basically represent different organization level of data. Collapsing and Expanding Columns after Column Grouping For this, we would be pressing the given "-" symbol or the buttons in the outline bar in for the purpose of collapsing all the month columns; and once we are done with this, we can observe that all the month of the selected Columns gets completely disappear, and the Positive "+" buttons in the outline bar appear as well. 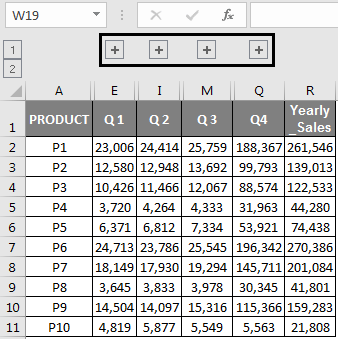
After that, the sales data will look concise and compact and like well-organized and structured financial data. Suppose we want to check out any specific monthly sales data in this respective case, so we can easily expand them again by just pressing out the "+" buttons present in the outline bar so that all the monthly sales data will get appears. 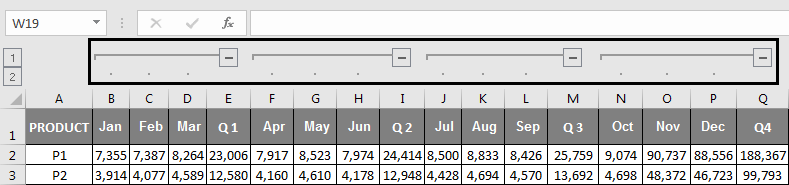
And the other way that can be Access or hiding out the monthly data is by making use of 1 or 2 options present on the left side of the worksheet, and that it is called as a state, 1st option is called a hidden whereas the 2nd option is called as the unhidden state, as it will be expanding those hidden columns. What important things need to be remembered by an individual in Microsoft Excel?The various important things that need to be remembered by an individual while working with the Grouping of columns in Microsoft Excel are as follows:
|
 For Videos Join Our Youtube Channel: Join Now
Feedback
- Send your Feedback to [email protected]
Help Others, Please Share


