How to Set Up Your Trading Screens
The market in the modern world has evolved into some unusual and complicated kind of organism that has thousands of data points that compete against each other to get the attention of the market people. It is for us to correctly evaluate these loads of information and convert it into a set of charts, indexes, tickers, and indicators that are efficient and profitable for our profile objectives. This task demands an indebt understanding of the broad market forces, while the balance requires a slight focus on the particular securities that are used to execute our strategies. More than half of the traders trading in the markets have real-life jobs and responsibilities far away from their homes which leaves smartphones as the only option to access the market, and their pint-sized screen fails to provide the users with the information they desire. These kinds of users keep trying to access the information that is needed to predict upcoming risks and manage the positions open to profitable or unprofitable results.
Key Takeaways
- When a person is an active trader, their trading platform becomes their workstation, and a good set-up for their screen layout can help them properly utilize the information that is there in front of them.
- Whether there are one, two, three, or even more screens, make sure you can quickly locate the tools and information you require so that you can respond when a signal arrives.
- Numerous platforms have pre-set defaults tailored to specific user categories as well as customizable and modular screen customization.
Trading from Screens
- There are a large number of people who own particular shops for trading or have their platform set at home and practice full-time trading. These people are bound to greater risk because of their full-time investment into this job and, more and more onscreen information that is detailed and allows them to know every move in the market.
- The additional data that these people access covers the same territory as a normal participant but in a very detailed manner. In addition to the continuous data updates, such full-time traders need to set aside some space for incubation in their trading practice to make room for future opportunities and their focus on those market groups which aren't in trade at the time.
- It often occurs to new traders that to practice full-time trading, how many monitors do a trader would need to practice trading at home and watch the market efficiently? The answer to this question is not at all simple and neither constant. It has been changing as the years pass by. The reason is that the prices of monitors have changed substantially, and multiple monitor set-ups are supported routinely by graphic cards nowadays. As the price of the monitors is low, it comes in handy to install as many monitors in the space set up for trading as the person wants, keeping in mind the fact that they all should fit comfortably and the trader should be able to process and analyze all the information that is being put on those screens.
- Also, in the thought of installing a large number of screens, a trader should never go out of budget and suffer problems.
Building Effective Trading Screens
- Generally, the trader isn't very well at capturing the three kinds of information that are needed to support a comprehensive visual analysis. These include things like position management, market observation, and, of course, incubators. Even a single inch of a screen, if used up in filling an unnecessary chart or data, it contributes to a blurred or incomplete view of the trader or the market that costs a lot if it happens in an active trading style. Almost all the traders that are successfully working in the market have committed a very common mistake in their trading careers which is to fill up their monitor screens with a lot of charts but not many tickers.
- A trader should reverse charting to keep an eye on must-watch tickers and set a second group to another time zone that would link us to a single symbol from the watch list (for those who don't know, a watch list is a list of securities that the traders keep an eye on to grab investing opportunities and earn a profit). If a trader doesn't have that much space for a different time zone, fewer charts can have a time frame toolbar added, allowing you to change the chart's parameters. The periods used for this study should be consistent with your market strategy.
Although not mandatory, the following configurations provide a decent place to start:
- 5-minute, 15-minute, and hourly charts for
- 15-minute, hourly, and daily charts for Swing Traders
- Hourly, daily, weekly, and monthly charts are two options for Market Timers.
Among the must-have charts are the following:
- 15-minute time frame selected for SPDR S&P 500 Trust (SPY) or S&P 500 futures.
- Set to a 15-minute time frame is Powershares QQQ Trust (QQQ) or Nasdaq 100 Futures.
- The 15-minute time frame for the Cboe Volatility Index (VIX).
- 15-minute daily charts for market-moving securities like the US Oil Fund, Apple Inc. (AAPL), and SPDR Gold Shares (USO).
- If at all possible, maintain two sets of S&P 500 futures charts: one for the U.S.-only session, which runs from 9:30 a.m. to 4:15 p.m. ET, and a second 24-hour, 60-minute chart that tracks overnight trading in Asia and Europe.
- When you first open your workstation in the morning, this second chart is quite helpful for getting you up to speed.
- A real-time news ticker can be an option. Because certain techniques depend on breaking news to execute positions, while the rest function flawlessly with a stand-alone third-party service or a well-curated Twitter stream, this is a personal decision. To preserve the limited area for charts and security tickers, it is often advisable to keep the news off of your data and charting tools.
Sample Set-Ups
The images that are given here highlight the correct ways to use screen space to enhance efficiency in trading, not depending on the number of monitors that are being used to watch the market. The panels that are given in these examples turn out pretty handy when new screens are added or when someone is taking a small laptop for travel. When there is a problem with space, one can reduce the number of securities and chats while staying put with the whole set of indicators and indexes.
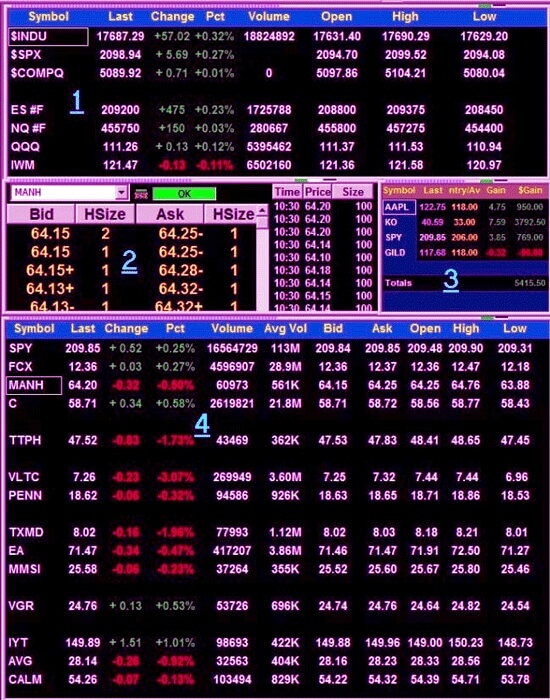
- The top panel (1) highlights Important benchmarks by providing comprehensive data on the S&P 500, Russell 2000, Dow Jones Industrial Average, and Nasdaq indexes. Futures contracts for the S&P 500 and Nasdaq 100 are placed at eye level for traders to view in real-time throughout the trading day. The columns for the open, high, low, and last data show how the price interacts with important levels, which also serve as intraday support and resistance.
- The Level 2 market depth screen Is disassembled in the center-left panel (2) by removing unnecessary columns in favor of a simplified layout that only shows price and size.
- Due to high-frequency trading algorithms, the majority of intraday transactions no longer appear on this screen, rendering market center data useless (HFT). Only time, price, and size are displayed in the time and sales ticker on the right side of the screen.
- For long-term positions, a condensed portfolio view is shown in the center-right panel (3). Although it is not necessary, it comes in very handy when a position goes south, and the trader needs to focus. Detailed information on open positions and securities being watched for entry can be found in the lower panel (4). Price and percentage change indicate intraday performance, whilst volume and average volume indicate the level of activity about earlier sessions.
- In many instances, open, high, low, and last columns take the role of charts, providing a simple depiction of the daily trend.
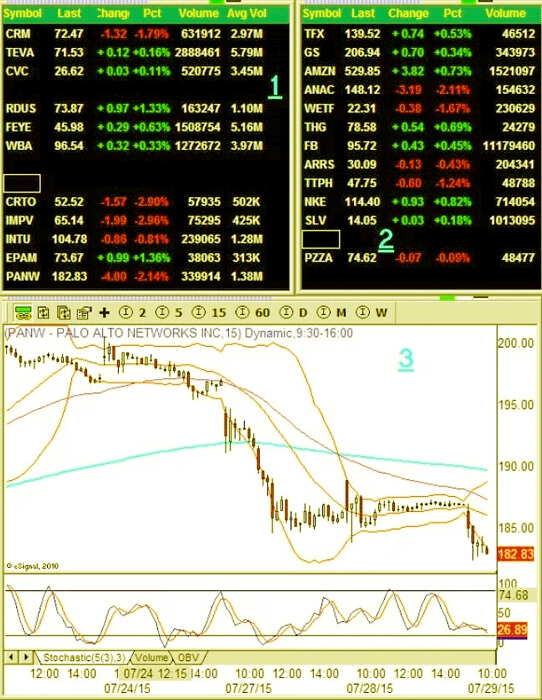
- Scaled-down information is shown on secondary ticker lists in the top left (1) and top right (2) panels. These are gathered over time via the news, scans, assignments, media play, and all the various ways we discover intriguing trade set-ups. These lists' volume and average volume sections are particularly crucial because they quickly and easily reveal which securities are active. Through the green symbol in the upper left, chart (3) is connected to tickers on all of the panels. By clicking on the top toolbar, traders can also choose between time frames, from two minutes to monthly.
- The panels that are there on the top left(1) and top right (2) show the traders the scaled-down data on the list of secondary tickers. This bunch of information is compiled through various sources such as scans, news, homework, media, and various ways in which we can find trading set-ups interesting enough to add to the screen. Some columns are especially important on these lists, such as Volume and Average Volume columns, as they help in identifying securities that are active with just one look. Chart (3) links to tickers that are present on all the panels (upper left side). Traders also have an option of flipping through the time frames, for example: From two-minute to monthly or yearly, but just one click on the top toolbar.
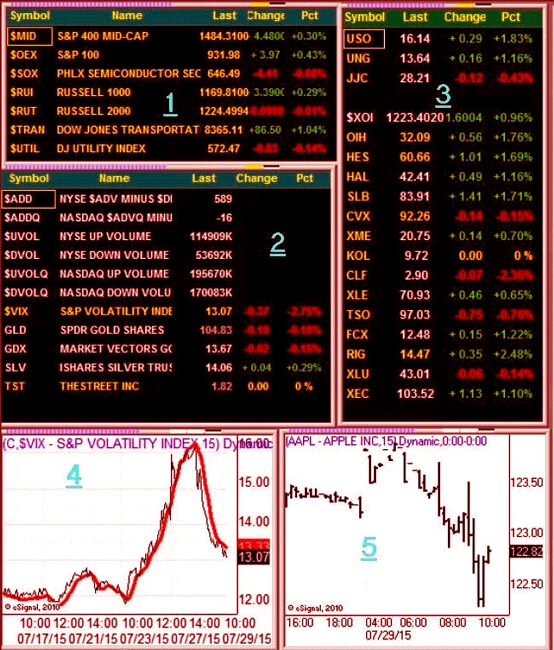
- Panels present on the central left (2) and the top left (1) show us the key indexes and the market internals that are not visible on the first screen. One must keep in mind that it takes a lot of time to clearly understand and interpret this background information correctly, but the learning effort is worthwhile as it helps in generating good skills in tape reading.
- The panel present on the top right (3) has the same columns as that of the other secondary lists, but it focuses on a specific market group, which is energy and commodities, in our case. Finally, the chart present on the bottom left (4) keeps a real-time VIX on display, and the chart on the bottom right (5) displays the core securities that we are going to observe for years and even decades.
- Market internals and important indices not visible on the first screen are displayed in the top left (1) and center-left (2) panels. It takes time to develop an accurate interpretation of this background information, but the work is valuable because it develops important tape-reading abilities.
The Conclusion
The intraday market action is summarized on well-designed trading screens, which divide it into manageable chunks to speed up complex trading decisions and reveal conditions that could develop into full-fledged rallies, sell-offs, and reversals. These screens can mark a definite trading edge that can last a lifetime if they are built carefully.
|

 For Videos Join Our Youtube Channel: Join Now


