| |

Hyperbola GraphA hyperbola is a graph of two curved lines intersecting at two points or vertices. The branches, the Hyperbola's two curves, can point in various directions. In its most basic form, the Hyperbola is a shape resulting from the intersection of two lines of equal length running in opposing directions. A hyperbola is symmetric along its conjugate axis and resembles the ellipse in many ways. A hyperbola is subject to concepts like foci, directrix, latus rectum, and eccentricity. Hyperbolas are frequently used in mathematics to show the intersection of two inversely related relations. For instance, hyperbolas are frequently used in economics to depict the link between the supply and demand for a specific good. Hyperbolas are frequently used in physics to depict the orbit of a heavenly body in space. A hyperbola's equation can be represented as a second-degree equation. It's crucial to understand that a hyperbola's equation is non-linear, which means it doesn't have a straight-line shape. A hyperbola's equation is also not symmetrical, which means that its two branches might have various shapes. A hyperbola graph is a curve formed by two intersecting lines. A hyperbola's two branches will always be curved; however, depending on the equation, the specific form of the branch can change. Additionally, depending on the equation, the Hyperbola's vertices can be located anywhere on the graph. 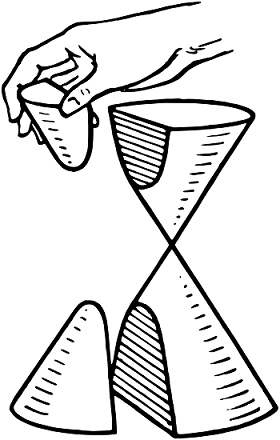
Parts of Hyperbola GraphLet's go through a few key terminologies about the various hyperbola parameters.
Hyperbola EquationThe general equation for a hyperbola is shown in the equation below. Here, the Hyperbola's transverse axis is represented by the x-axis, while the y-axis represents its conjugate axis. Standard Equation of the HyperbolaThe Hyperbola has two standard equations. The transverse axis & conjugate axis of each Hyperbola is the basis for these equations. The standard equation for the Hyperbola is Another standard equation for the Hyperbola is The image below depicts the two standard forms of hyperbola equations. 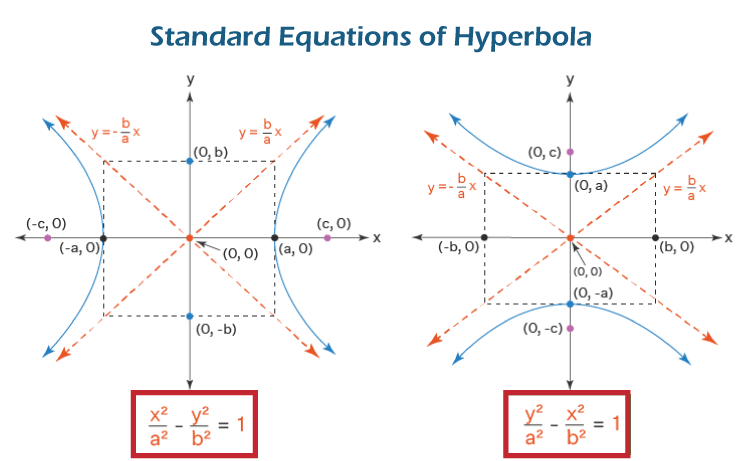
Advantages of Hyperbola GraphCompared to other graph types, the hyperbola graph provides several advantages.
First, it accurately represents the reciprocal relationship between two variables. As a result, it is simpler to determine each variable's cause and effect. Any changes to one variable will cause a corresponding change in the other since the two variables are moving in opposing directions. As a result, understanding the link between the two variables is simpler.
Compared to other graph forms, the hyperbola graph is more visually appealing. Curved lines, like the hyperbola graph, are simpler to read than straight ones. The lines make it simpler to see how the two variables are related.
The hyperbola graph can represent a wide range of relationships. It can be used to depict relationships between two exponential, linear, or even logarithmic variables. It is, therefore, an extremely flexible tool for graphing many kinds of connections.
A hyperbola graph can be useful in determining the range of values for a particular variable. For instance, a hyperbola graph of a car's speed and distance may be used to determine the car's maximum and lowest speed ranges. This is especially helpful for issues with a limited range of potential values.
Another advantage is that hyperbola graphs may also simplify complex mathematical equations. For instance, we can see the relationship between the two variables by graphing an equation with two variables. This is very helpful when attempting to solve complex equations. Disadvantages of Hyperbola GraphAlthough the Hyperbola graph is an effective tool for comprehending and displaying complex data, it also has several disadvantages that should be considered before using it.
Some individuals may find it challenging to understand the Hyperbola graph since it is difficult to interpret. Without much expertise and knowledge, it might be challenging to interpret the graph's curves. This might make it difficult for someone to rapidly and accurately interpret the data.
The Hyperbola graph is restricted to the number of data points you enter. The Hyperbola graph cannot be used to display data points outside the range.
There isn't a single method to analyze the data since the Hyperbola graph is a non-standard graph type. Many individuals may interpret the same graph differently, leading to various interpretations of the data.
There are not many modification options available for the Hyperbola graph. The graph's color, line type, labeling, and other elements cannot be altered. The graph's utility is so constrained.
Large data sets should not be represented using the Hyperbola graph due to its complexity and complication. The graph will get extremely difficult to interpret as more data points are put into it.
The hyperbola graph cannot be used to display trends. Identifying trends in the data is challenging since the graph's form remains constant as data points are added or removed. The ConclusionThe Hyperbola graph is an effective tool for comprehending and displaying complex data, but it also has several disadvantages that should be considered before using it. Large data sets, trends, presentation needs, grouping, or all data kinds are not appropriate uses for it. The interpretation and comparison of data points are sometimes challenging. Weighing the advantages and disadvantages of the Hyperbola graph is essential before deciding whether to use it for your data.
Next TopicLinear Graph
|

 For Videos Join Our Youtube Channel: Join Now
Feedback
- Send your Feedback to [email protected]
Help Others, Please Share


