| |

Latex Bar Graphs and Pie Charts using TikzBar GraphsA bar graph is a graph or the chart that represents the information with rectangular bars with height or width corresponding to the data value they presents. The bar graph is generally of two types, vertical bar graphs, and horizontal bar graphs. It shows the comparison among the discrete categories. Some graphs also present the cluster bars, which are grouped and demonstrate the value of more than one variable measured. Tikz is the most powerful and complex tool used to create graphic elements in Latex. In Latex using tikz, bar graphs can be created effectively. Let-s consider a simple example to create bar graphs. The code for such an example is given below: Output: 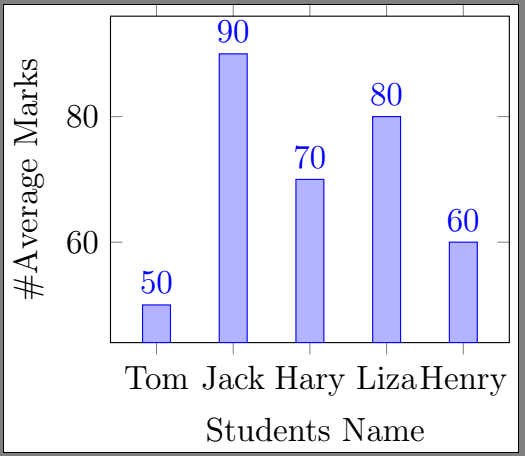
Let-s consider another example. It is a little complex than the first one, but easy to understand. The code for such an example is given below: Output: 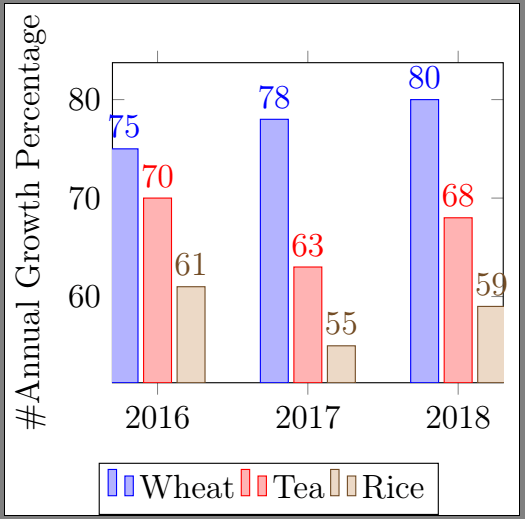
Pie ChartsThe pie chart is a statistical graph, which is circular in shape. The graph is further divided into slices defining a numerical proportion. The pie charts are used to represent part of the whole relationship. All the pieces of the chart together present 100%. The pieces in the pie chart in each category are proportional to the fraction of the whole class. The code to create a simple pie chart is given below: Output: 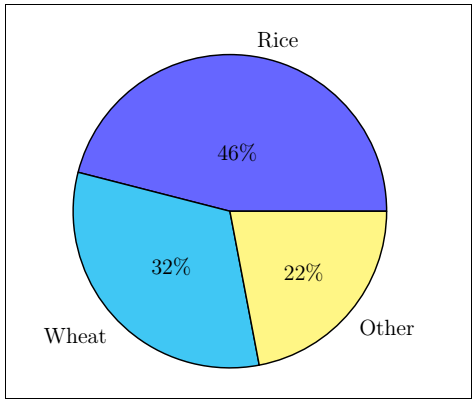
If you want to rotate your chart by any angle, you need to use the rotate command. The code for such example is given below: Output: 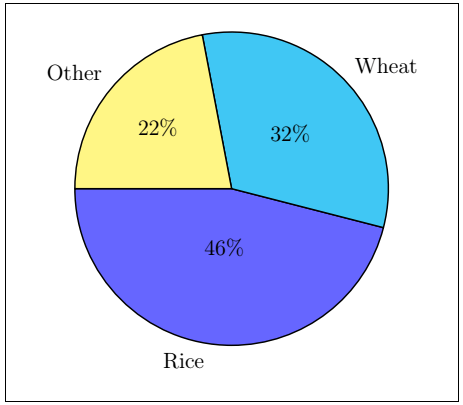
If you want to place the text inside your pie chart, then you need to use the text=inside command. The code is given below: Output: 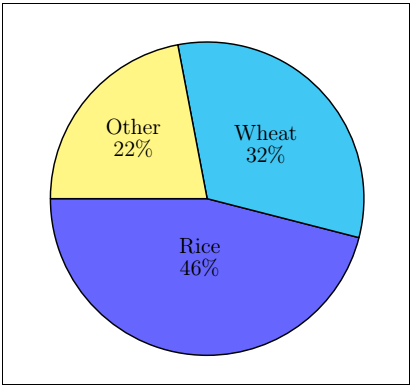
The colors shown in the above diagram are the default colors of Latex. You can also modify the colors. The other such command that can be used for further modification are listed below:
Note: All the extra parameters should be passed within the square brackets before the \pie command.Let-s consider an example to modify the color and to change the format of the text. The code for such an example is given below: Output: 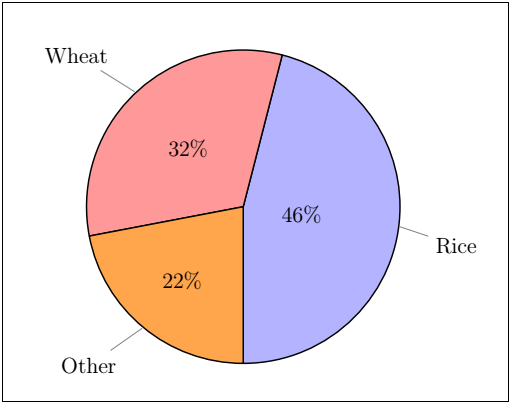
There are three other types of charts, namely, square charts, cloud charts, and polar charts in the pie charts category.
The cloud charts can be created by including the cloud command inside the \pie. The code will be the same as that of the pie charts. The difference here is that only the cloud is included inside the \pie command. The code is given below: Output: 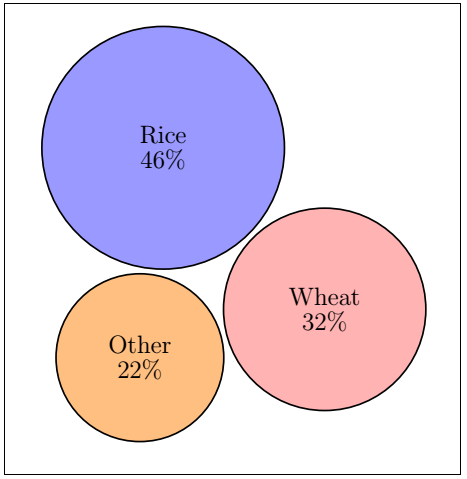
Square ChartsThe square charts can be created by including the square command inside the \pie. The code will be the same as that of the pie charts. The difference here is that only the square is included inside the \pie command. The code is given below: Output: 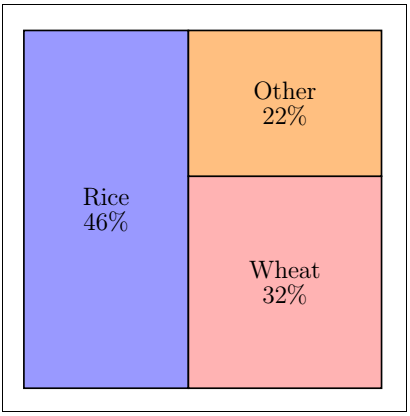
The polar charts can be created by including the polar command inside the \pie. The code will be the same as that of the pie charts. The difference here is that only the polar is included inside the \pie command. The code is given below: Output: 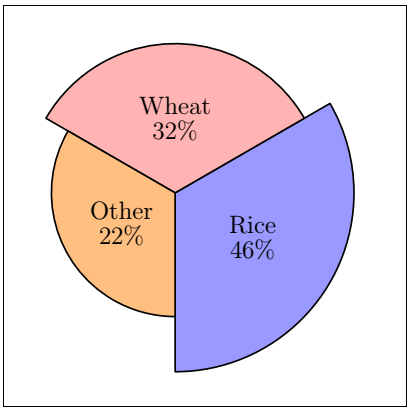
You can also explore the slices of the chart by using the explode command. The code to explode the slices of the polar chart is given below: Output: 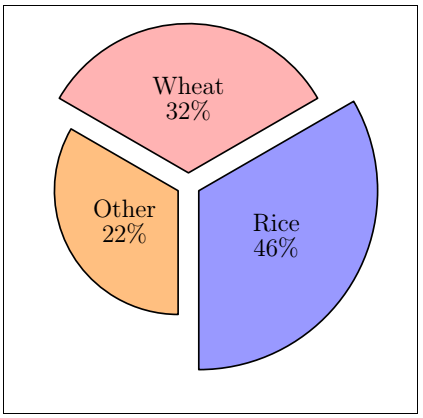
Next Topic#
|
 For Videos Join Our Youtube Channel: Join Now
Feedback
- Send your Feedback to [email protected]
Help Others, Please Share


