| |

Latex graph of equations using TikzA graph is a pictorial representation of data connected by links. The graphs can be created through the tikz environment and without the tikz environment as well. But the graphs with equations are better by using the tikz environment. In this topic, some examples are with equations, and some are the graphs with the use of vertices only. Let-s consider an example to draw a graph for Temperature and Resistance. Each step would include the explanation of the corresponding command. The description of that command will begin with the %. The code to draw the graph is given below: Output: 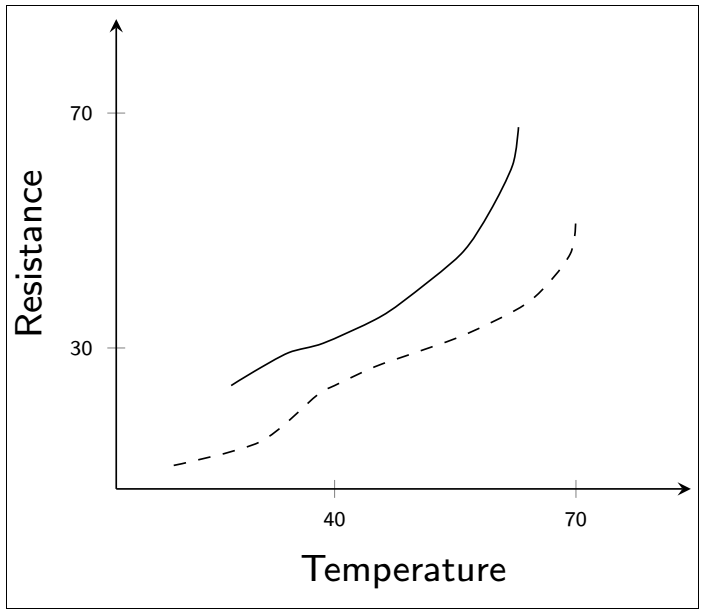
Determination of Axis of GraphThere are two types of axis commonly used. The first one is the simple graph, which contains four quadrants, and the other is the axis, which is used to draw bar graphs, etc. To draw x and the y-axis, it is necessary to declare some packages, sets, and libraries. These will be listed in the code given below. Let-s consider the first example to draw the axis of four quadrants. Output: 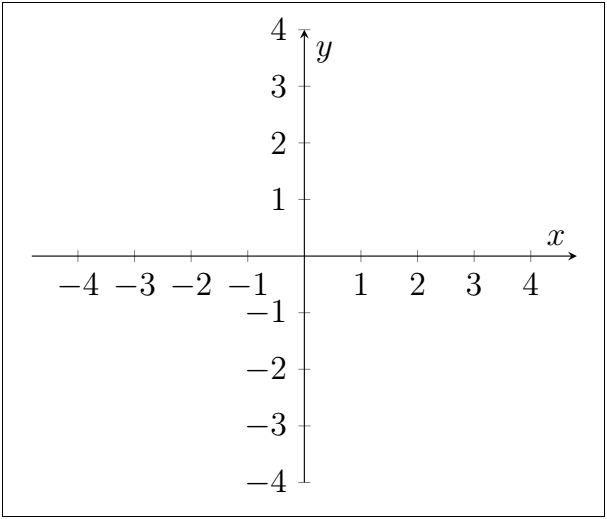
There is only one difference between the two examples, i.e., to determine the type of style. The code to draw the axis suitable for bar graphs etc. that produces only one quadrant is given below: You need to use left or right (for inverted axis) instead of the middle (for four quadrants) option in my style category. You can notice the change. Output: 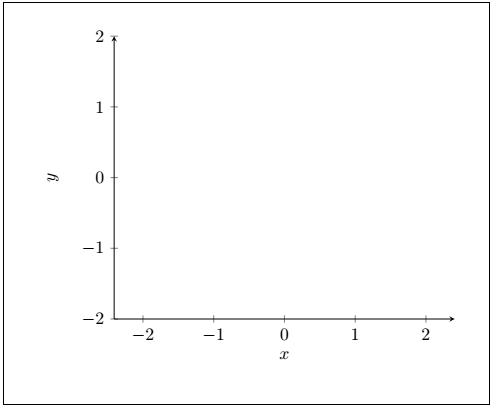
Note: The number of dots (..) between the numbers specified in the -my style, xtick={-2,-1,...,2}, ytick={-2,-1,...,2} - command should be equal. Otherwise, Latex will consider an error.Graph of equationsYou can also draw graphs with the use of equations. The packages, sets, and libraries will be the same as used for other types of graphs.
The example is to draw a graph with the use of only one order equation. The equation is given below: 
The code to draw such type of equations is given below: Output: 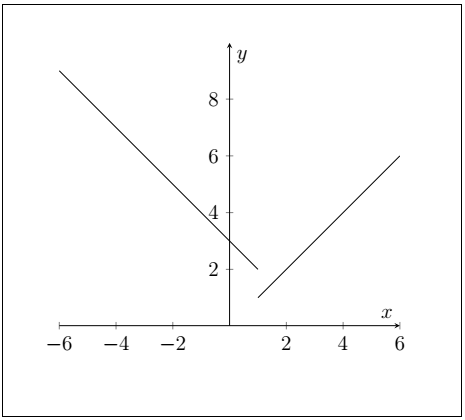
You can also draw the graph for the equations of second order. The code and the commands will be similar to the above type of graphs. Let-s draw the graph for y=x2 The code for such type of graphs is given below: Output: 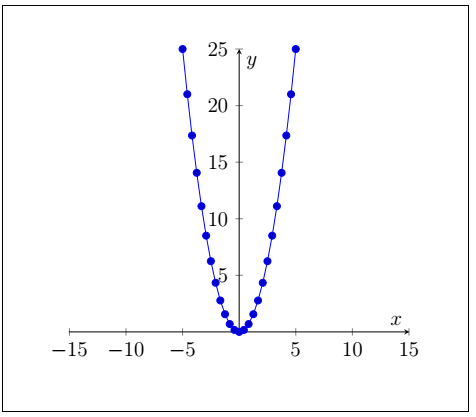
Similarly, you can draw any shape and graph in Latex using the methods discussed so far. Polar CurveLatex also provides the feature to draw the area enclosed by the polar curve. Here, the code will be similar as the above method. Let-s draw the area enclosed by the curve, r2=2 sin?θ In this case, a few changes are necessary. The first one is to include the samples. The samples are used to draw smooth graphs. It is used in complex graphs, such as polar graphs. You need to include samples=100 in the code. The other is to specify the domain. It depends on the user to determine the range for a domain according to the requirements for the graph. To draw the polar curve, you need to use polaraxis environment instead of the axis environment, which is given below: The equation r2=2 sin?θ will now become,r=√2 sin?θ The axis used to draw polar curves are different from the usual axis. To implement polar curves, following preamble must be declared: All the above parameters are the tick labels of the graph used to determine the polar curve. The code to draw the polar graph is given below: Output: 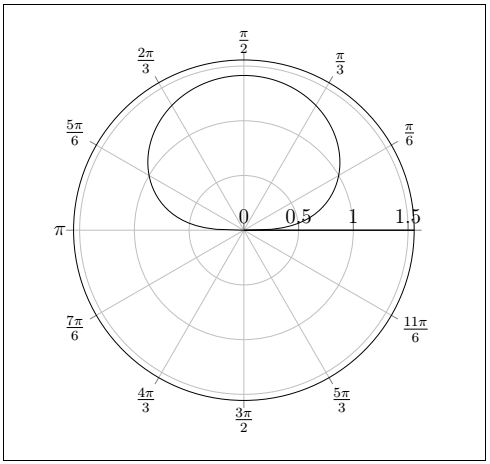
|
 For Videos Join Our Youtube Channel: Join Now
Feedback
- Send your Feedback to [email protected]
Help Others, Please Share


