| |

Latex GraphsThe graph is the visual representation of the data. In similar ways, graphs are used in Latex for the illustration. The casual models are also a way to represent information termed as node graphs. The graphs are used to represent information in 2D as well as 3D. The package is used to implement the graphs in Latex. The package is declared as: Here, all define the packages at once, and xy is the axis used to draw the graph. Basics GraphsThe various types of graphs are used to represent the information, which is listed below: Bullet GraphsIn the bullet graphs, the point in the axis is named as(x-point, y-point), where x point the point on the x-axis and y point is the point on the y-axis. The corresponding bullet point is drawn at the (x, y) point mentioned here. The name of the node is determined using the \bullet_{..} command. The command to draw the bullet graph is \xygraph{...}. The code for this example is given below: Output: 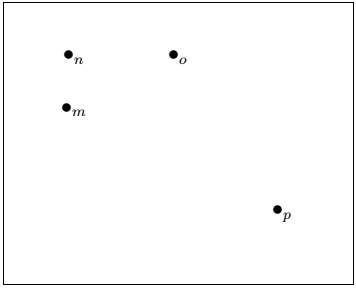
Now, let-s change the value of the points. You can easily compare the new output from the above output. The new code is - The output for this example is: 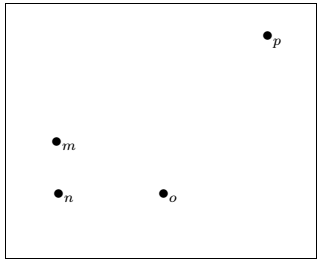
You can easily compare that the y-axis is reversed in the above example compared to the first example. Similarly, you can change the values according to the requirement. Let-s consider another example for a better understanding. Now, change the point of the axis to 0.5. The code for this example is given below: The output now will appear as: 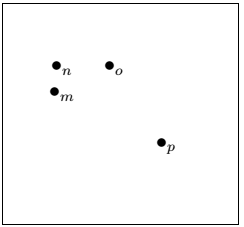
If you want to enclose the bullet or vertices graph in a frame, then you need to use the fbox command. The fbox command in Latex is written as: \[ \fbox ...text to enclose inside a frame.....\] The code for this example is given below: Output: 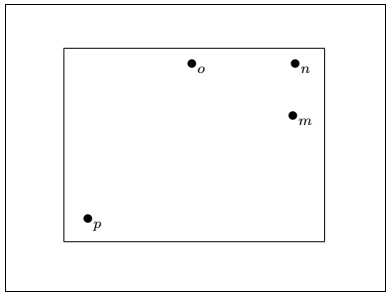
Directed GraphsThe procedure to draw a directed graph is the same as that of bullet graphs. You need to include the path from a vertex to the particular vertex or bullet. The path is determined as "r "- "s," where r and s are the specific vertices. The code for such example is given below: Output: 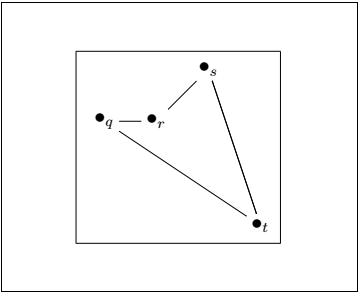
Arrow EdgesFor the arrow at the edges, you need to use -:- instead of --.- The code is given below: Output: 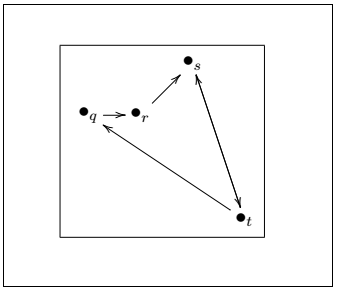
Bending EdgesFor bending edges, you need to use -@/^/ between the two vertices. For example, if you want to draw the bending edge between a and b vertex, you need to mention the command as "a" -@/^/ "b". The code for this example is given below: Output: 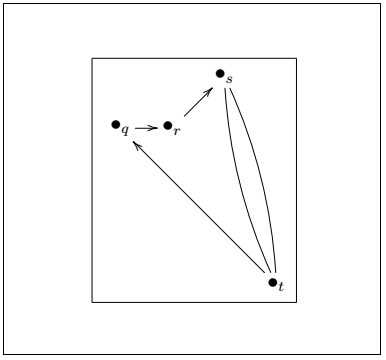
You can also determine the length of the bending edge by specifying it between the commands. For the length of 1cm you need to mention as -@/^1cm/. The code for this example is given below: Output: 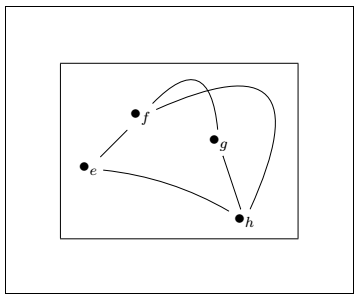
Labels on EdgesYou can also label the edges of the graph. The label of edges is specified at the end of the directed command as ^(distance of label from particular vertex ) {e_1}. You can use any character or number instead of {e_1} command. The code for such example is given below: Output: 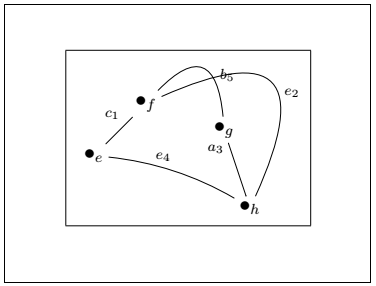
Color Vertices and EdgesYou need to mention the name of the color before the \bullet command to color the vertices. If you-re going to color the edges, you need to mention the color name before the directed command. You also need to specify the xcolor package to implement color on the edges or vertices. The code to color the vertices is given below: Output: 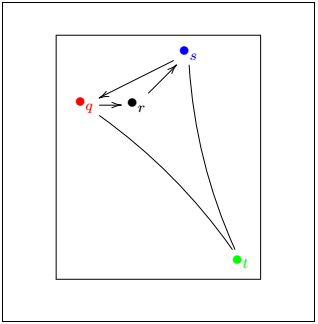
The code to color the edges is given below: Output: 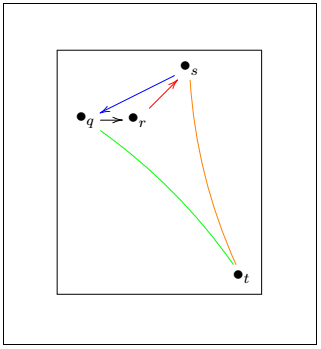
Double Graphs with Polar CoordinatesIn null object, the origin is specified at each vertex to draw the graphs. You need to determine the angle depending on the number of sides of the polygon. For example, the angled gap of 72 degrees is specified for a polygon with five sides, and an angled gap of 60 degrees is defined for a polygon of six sides. The formula calculates the gap = 360/n Where n= number of sides of the polygon For the irregular gap of the angle, the Latex will give an error. The graph is drawn only with the uniformity all over. The command to specify the angle, distance between two polygons, and vertex is written as: !{(0,0);a(0)**{}?(1.0)}*+{\bullet}="a1" Where, (0,0) is the origin a1 is the name of the vertex Following are two examples given to explain the above process. The code for the first example to draw double graph triangle is given below: According to the above formula, the gap of 120 degree is used for the three sides of a polygon. Output: 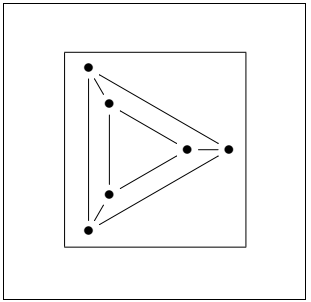
The code for the second example to draw double graph octagon is shown below: In above code, we have taken 8 sides of polygon. The angle gap calculated by the formula will be 45 degree. Output: 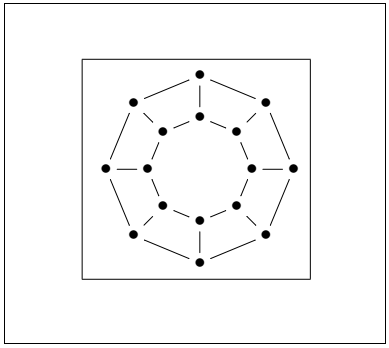
Loops in graphsThe loops are created on the vertices. The method to develop a loop is to modify the edge command with the minus sign and the @ (a1, a2), where a1 and a2 are the in and out directions. The choices for the directions are l (left), u (up), r (right), d (down). The directions dr, dl, ur, ul are used for the four diagonals. The code to create loops is given below: Output: 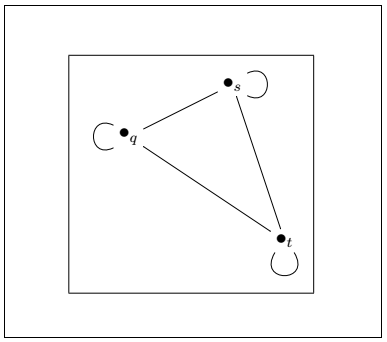
You can make as many loops depending on your requirements.
Next TopicLatex smart Diagrams
|
 For Videos Join Our Youtube Channel: Join Now
Feedback
- Send your Feedback to [email protected]
Help Others, Please Share


