| |

Map DefinitionA Map is a graphic representation of certain characteristics of a place, frequently made on a flat surface. Maps offer clear, readable information about the world. They provide information about the world by displaying the sizes and shapes of the globe's nations, the locations of features, and the distances between areas. 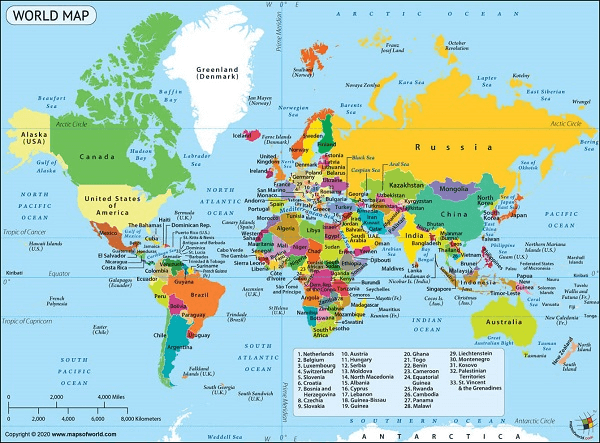
Maps may display how things are spread around the globe, including population areas. In a city neighborhood, they can pinpoint the exact positions of streets and homes Cartographers are those who create maps, and they do so for a number of purposes. Travelers use road maps to plan their travels. Weather forecasts are made by meteorologists, who are specialists in the weather. Maps indicating land characteristics and how the area is presently used assist city planners in determining where to construct hospitals and parks. Map Elements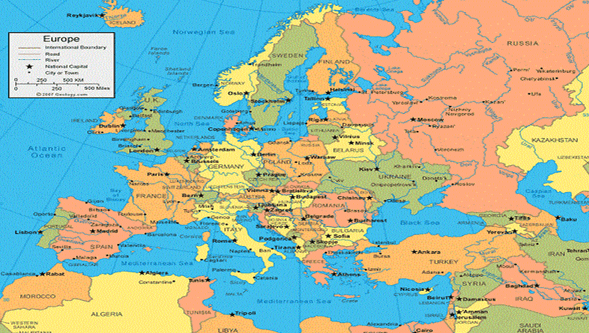
1. ScaleEvery map shows the world at a certain scale. The map's scale describes the distances represented on a map and the actual distances on Earth. One can use a representative fraction, a verbal scale, or a graphic scale to depict this connection. The most popular kind of graphic scale resembles a ruler. It only consists of a horizontal line delineated in miles, kilometers, or any other distance-measuring unit. It's also referred to as a bar scale. The verbal scale is a phrase that connects geographic distance to geographic distance on Earth. A verbal scale would say, for example, "one inch represents eight miles" or "one centimeter represents one kilometer." The representative fraction has no specific units. A fraction or ratio represents the value, such as 1/1,000,000 or 1:1,000,000. It indicates that there are one million of each particular unit of measurement on the map for every unit on Earth. In other terms, 1 centimeter on a map is equivalent to 1,000,000 cm on Earth, or 10 kilometers. On the map, one inch is equivalent to one million inches, or around 16 miles, on Earth. The extent of the area covered influences the scale of a map. A neighborhood street map, for example, shows a region in great detail and features relatively large items. Because the map's components are often small, a map covering a wider region, such as the world or a continent, is called a small-scale map. Maps are frequently computerized today. The viewer can change the scale of many computerized maps by zooming in and out. A person may start by looking at a map of the entire city that only displays the major streets before zooming in to see every street in a neighborhood. 2. SymbolsSymbols are used by cartographers to represent geographic characteristics. Black dots, for instance, stand in for cities, circled stars for capitals, and other lines for borders, roads, highways, and rivers. Symbolic usage of color is common. Forests are frequently shown as green, deserts as brown, and water as blue. A map typically contains a legend, or key, that describes the symbols on the map and provides scale information. Some maps display relief or elevational variations. Contour lines, often known as topographic lines, are a typical approach to depicting relief. These are the paths that connect locations with the same elevation. On a large enough region, contour lines on a map will eventually form circles. An elevation change is shown by a collection of contour line circles around one another. These contour line circles signify a hill as elevation rises. Contoured line circles show a depression in the ground, such as a basin, as elevation drops. 3. GridsSeveral intersecting lines form squares or rectangles on many maps, creating a grid pattern. Locating locations on the map is made easier by the grid. Latitude and longitude lines are widely used as the grid on small-scale maps. Parallel to the Equator, a fictitious line that surrounds the center of the Earth, latitude lines go east-west across the world. From pole to pole, longitude lines travel north to south. Lines of latitude and longitude have numbers. The intersection of latitude and longitude lines or coordinates determines the location of a place. Maps with more information frequently include a grid with numbers and letters. The grid's formed boxes at the top of the map may have names like A, B, C, and so on, while the boxes at the left may have names like 1, 2, and so on. A park's location can be indicated as B4 in the map's index. The user may find the park by looking in the box where row 4 and column B meet. Projections of MapsProjecting transfers data from Earth's spherical, or ball-shaped, surface to a flat sheet of paper. A globe, a spherical representation of Earth, precisely shows the shape and positions of the continents. However, the outcome would be wrinkly and tattered if a globe were divided in half, with each half smoothed down into a map. Land masses would alter in size, shape, and relative placement. A significant issue for cartographers is projection. There is some distortion on every map. The extent of a map's area affects how distorted it is. When projected onto a flat surface, only some, not all, of these attributes may be precisely represented. On Earth, qualities like size, shape, distance, or scale may be accurately measured. For example, a map can only keep track of one of two things: the accurate proportions of landmasses or the proper forms of extremely small places. Cartographers must choose which accuracy components are most crucial to maintain based on the map's intended use. Which projection should be used depends on this. For instance, conformal maps distort size while showing the real geometry of tiny regions. Equal area maps reflect the correct relative sizes of all regions while distorting shape and direction. Planar, conical, and cylindrical projections are the three fundamental types. Each has its uses in various circumstances. A planar projection transfers the Earth's surface to a plane or other flat surface. Consider placing a piece of cardboard against a globe, mapping the point of contact, and then projecting the remaining portion of the map onto the cardboard all around that point. Planar projections are the most accurate when the plane "touches" the globe at its center. Maps depicting one of the poles frequently utilize them. Consider wrapping a cone around the planet and placing its point over one of the poles. Projecting in a conical shape. The cone pierces the globe along one or two latitude lines. As the cone is unwrapped and the latitude lines are transformed into a flat map, they appear to be twisted in circles or semicircles. Straight lines that meet at a single pole are called lines of longitude. Conical projection provides a somewhat realistic representation of mid-latitudes regions that are neither close to the Equator nor close to the poles. Conical projections are widely used for maps of the United States, most of which are situated in the mid-latitudes. Imagine the Earth's surface is projected onto a tube wrapped around the globe for a cylinder projection. One line, usually the Equator, meets the surface of Earth. The regions close to the Equator are shown with the greatest accuracy when the cylinder is sliced apart and flattened into a map. The most warped regions are those nearest to the poles. Remote Sensing and Surveying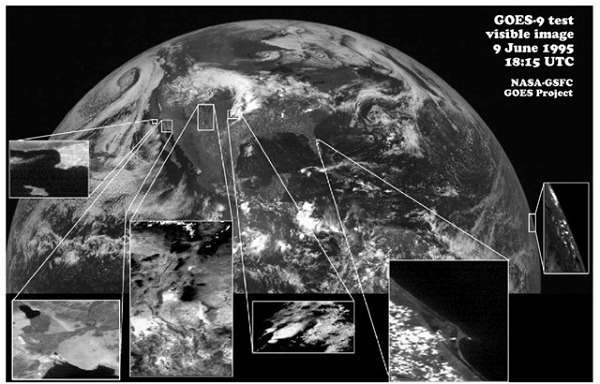
Survey data provide precise information about the world to cartographers. The art and science of surveying involve determining a piece of land's accurate dimensions, contours, and position. Surveyors gather information in both areas above and below water. One can conduct surveys on strolling. Surveyors employ various tools to measure the topography or characteristics of the land. Surveyors frequently employ theodolites, measuring instruments, and compasses when conducting fieldwork. A theodolite is a device used to measure angles. A surveyor can use a theodolite, frequently set up on a tripod or three-legged platform, to calculate the angle of hills, valleys, and other features. Today, many surveyors employ remote sensing to get information about a location without touching it. To gather data about locations on Earth from above, aircraft or space satellites are outfitted with sensors that detect light or radiation produced by objects. Aerial photography is a technique for remote sensing that involves capturing pictures of the Earth from the air. Surveyors no longer have to do as much physical labor and can now accurately survey some areas that are difficult to access on foot, thanks to aerial photography. Satellites and other spacecraft that orbit the Earth are used for remote sensing. For instance, the 14-times-daily orbiting Landsat satellite sends enormous amounts of data to computers on Earth. The information may be used to create or update maps fast. How to Create a Map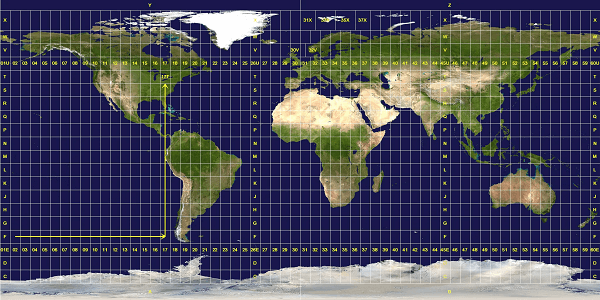
Various Maps
Cartographers create many kinds of maps, but they may be broadly categorized into two groups: themed maps and general reference maps. General reference maps display a region's major physical features, such as cities, borders, highways, mountains, rivers, and coastlines. Various government organizations, including the U.S. Geological Survey (USGS), provide various general reference maps. Many of them are topographic maps, which display elevational variations. They display every valley and hill in a certain area. Everyone may benefit from this, from hikers looking for a path to engineers looking for suitable locations for motorways and dams. Thematic maps display distributions or patterns throughout the Earth's surface. They put importance on one idea or subject. These topics may cover knowledge about humans, other living things, or the environment. Crop output, average household income, languages spoken, and average yearly rainfall is a few examples. The creation of several themed maps is made possible using geographic information system (GIS) technology. Geographic information (GIS) are computer programs that record, archive, and display information about locations on the surface of the Earth. This technology combines map data with additional data about people, the land, the climate, farms, households, businesses, and much more to enable various data sets to be displayed on a single map. Organizations and corporations widely use GIS technology for analysis and decision-making. For example, Geographic information (GIS) data enables officials to identify which streams are most at risk of contamination. A business may also use it to choose a new store's location.
Next TopicMeasurement Definition
|
 For Videos Join Our Youtube Channel: Join Now
Feedback
- Send your Feedback to [email protected]
Help Others, Please Share


