| |

MATLAB 2-D PlotsObjective: To study graphics, i.e., 2-D plots, printing labels, grid and axis box, text in plot, bar, and pie chart. ExampleOutput: 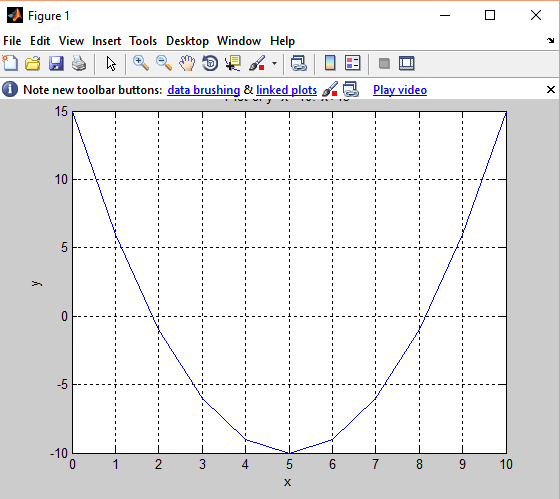
Multiple plots:ExamplesOutput: 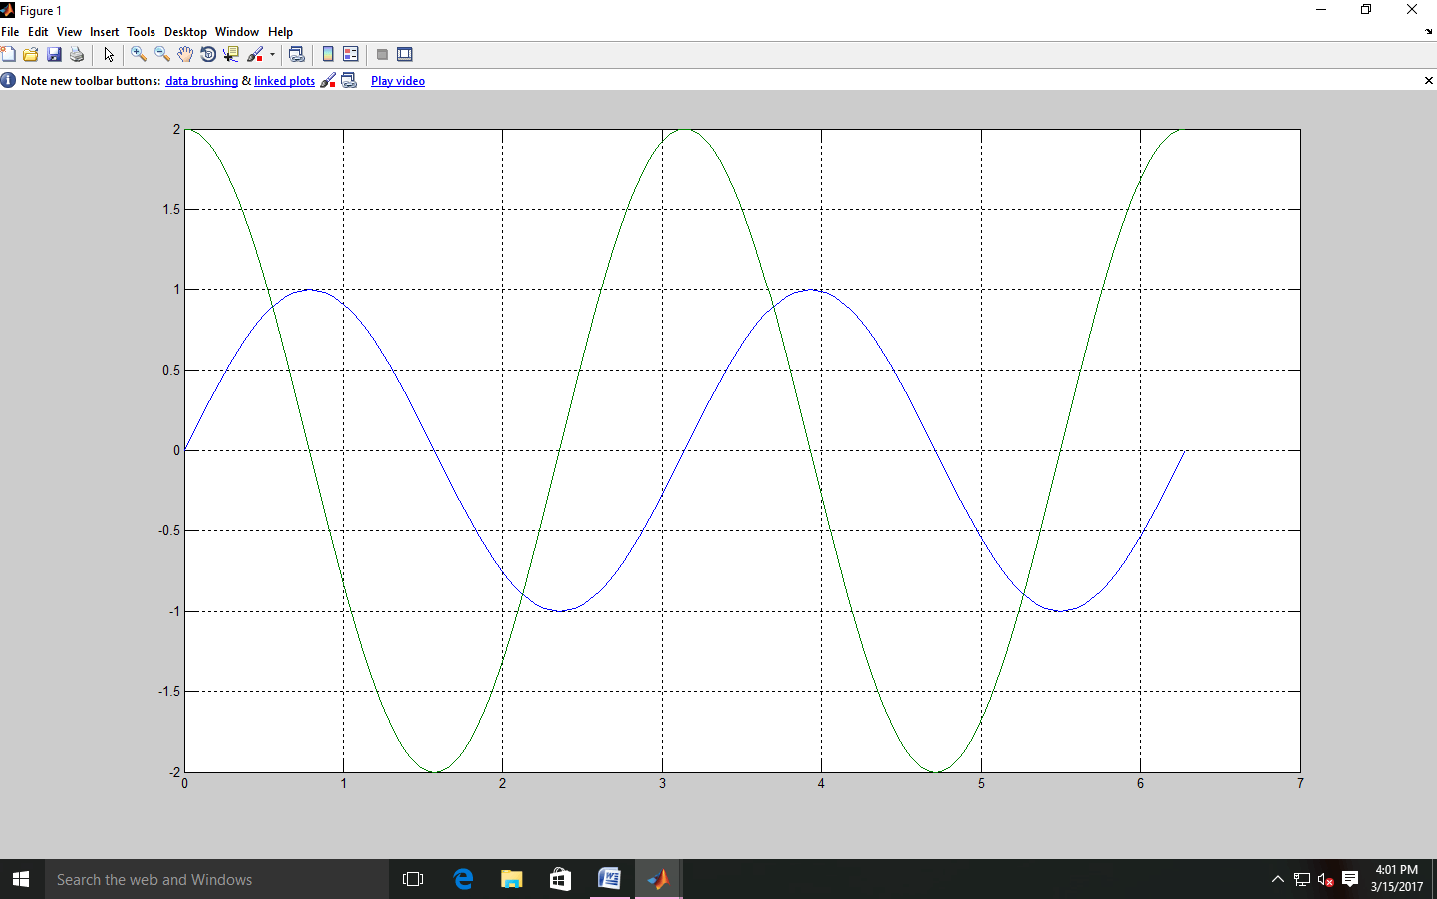
Line color, Line style, Marker style, and legends:
y
m
c
r
g
b
w
k
.  → point
o → circle
x → x-mark
+ → plus
*→ star
s → square
d → diamond
v → triangle(left)
^ → triangle(up)
< → triangle(left)
>→ triangle(right)
p → pentagon
h → hexagon
            <none> → no marker
-  → solid
-. → dashed dot
-- →dashed
.. → dotted
<none> → no line
TITLE: Title ('title_string', 'Font Name', Helvetica','Font Size',20.'color','green','Font Weight','light/bold/normal','Font Angle','Normal/italic'); AXES: Axes('Position',[left, bottom,width,height]) E.g.: To create axes at (0.2,0.2), size half of the figure window. axes ('Position', [.2 .2 .5 .5]); 
TEXT: To add a text string to a specified location in the plot area. text(r,c,'string'); GTEXT: need not to specify text location. gtext('string'); where we click, the text will be displayed there. LEGEND: Position of legend: top left top center top right ExampleOutput: 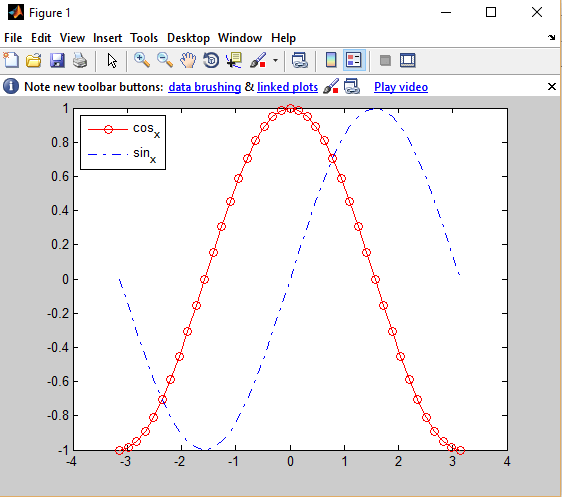
Statistical plots:pie(x):Example Output: 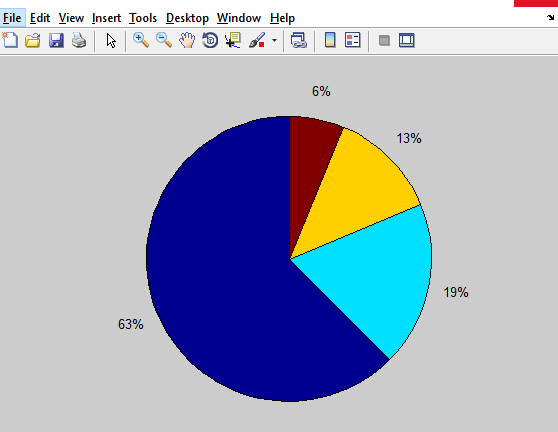
To pull out 3rd slide: Example Output: 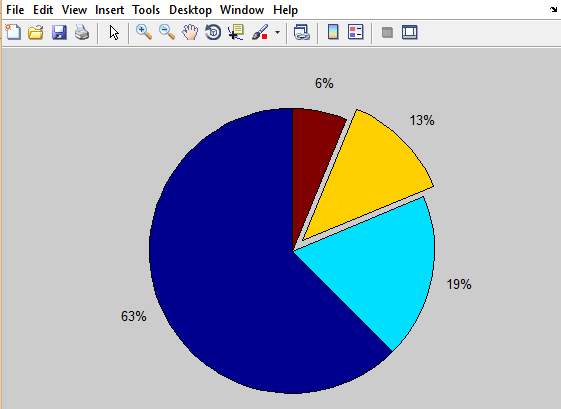
To pull text labels: Example Output: 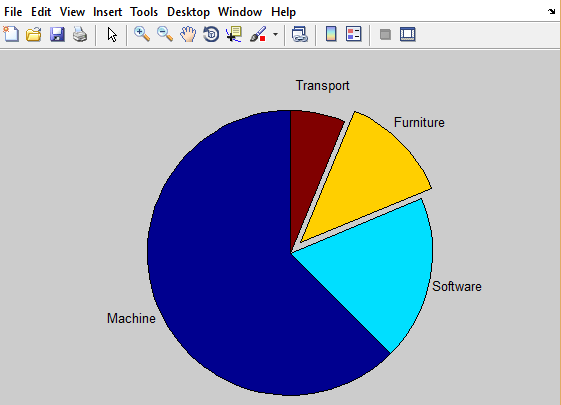
Bar graphs:bar(x): It plots the bar. Plot the values of x against the time index. bar(t,x): if we want to give t by ourselves. Example Output: 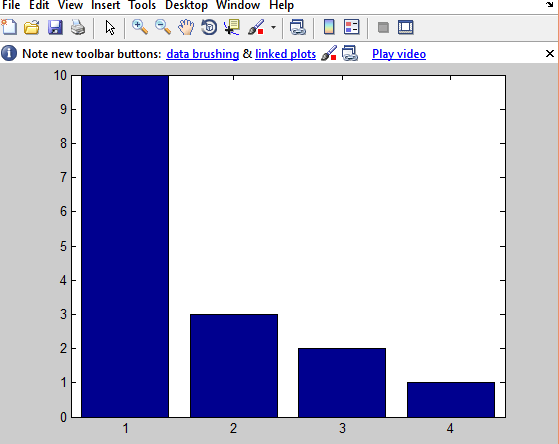
bar(x,'stacked'): Output: 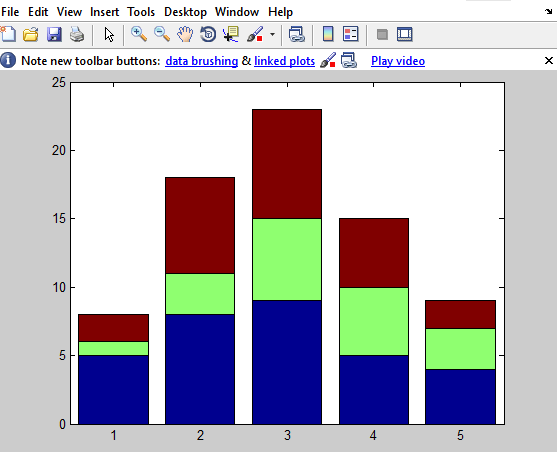
Print command: print<option><filename> options:
E.g.: print -djpeg myimg.jpeg
Next TopicMATLAB Sine Wave Plot
|
 For Videos Join Our Youtube Channel: Join Now
Feedback
- Send your Feedback to [email protected]
Help Others, Please Share


