| |

MATLAB compass()A compass plot shows direction or velocity vectors as arrows arise from the origin. X, Y, and Z are in the cartesian coordinates and plotted on a circular grid. SyntaxExampleOutput: 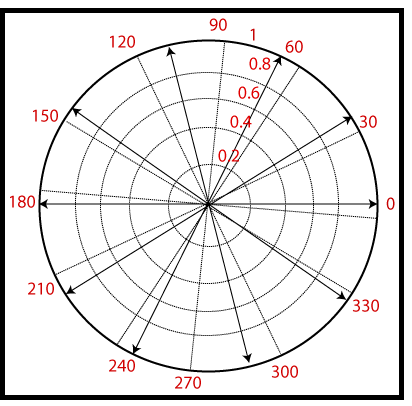
Next TopicMATLAB comet()
|
 For Videos Join Our Youtube Channel: Join Now
Feedback
- Send your Feedback to [email protected]
Help Others, Please Share


Like/Subscribe us for latest updates or newsletter 


