| |

MATLAB hist()A histogram is a plot presenting the distribution of values within a data set. To develop a histogram, the range of values within the data set is split into evenly spaced bins, and the number of data values falling into each bin is determined. SyntaxExampleOutput: 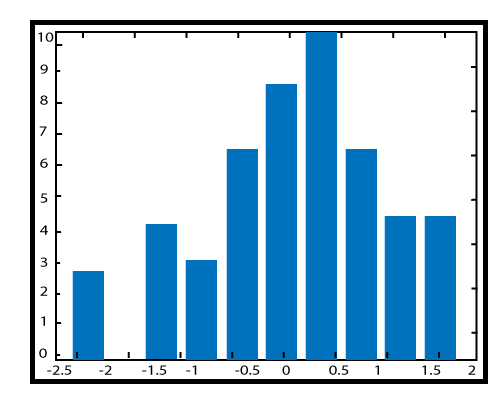
Next TopicMATLAB stem()
|
 For Videos Join Our Youtube Channel: Join Now
Feedback
- Send your Feedback to [email protected]
Help Others, Please Share


Like/Subscribe us for latest updates or newsletter 


