| |

MATLAB plotyy()It creates graphs with y-axes on both the left and right sides. SyntaxExampleOutput: 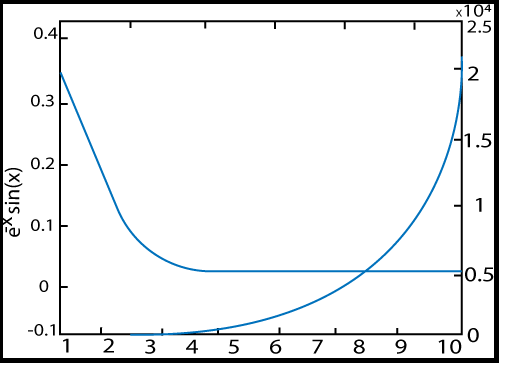
Next TopicMATLAB area()
|
 For Videos Join Our Youtube Channel: Join Now
Feedback
- Send your Feedback to [email protected]
Help Others, Please Share


Like/Subscribe us for latest updates or newsletter 


