| |

MATLAB Semilogx()It generates a plot of the values of x and y, using the logarithmic scale for x and the linear scale for y. SyntaxExampleCreate a plot with logarithmic scales for the x-axis and linear scales for the y-axis. Output: 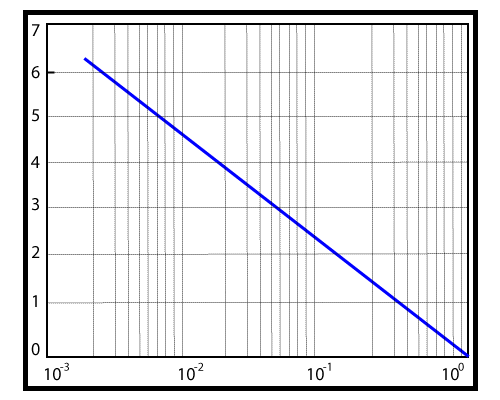
Next TopicMATLAB Semilogy()
|
 For Videos Join Our Youtube Channel: Join Now
Feedback
- Send your Feedback to [email protected]
Help Others, Please Share


Like/Subscribe us for latest updates or newsletter 


