| |

MATLAB plot3()The plot3 function shows a three-dimensional plot of a set of data points. SyntaxExamplePlot of a parametric space curve: Output: 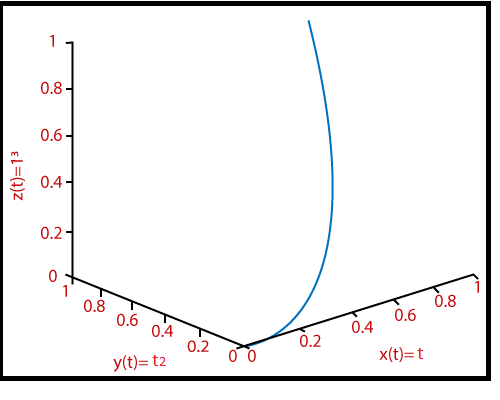
Next TopicMATLAB fill3()
|
 For Videos Join Our Youtube Channel: Join Now
Feedback
- Send your Feedback to [email protected]
Help Others, Please Share


Like/Subscribe us for latest updates or newsletter 


