| |

MedianIn statistics, the median is a value that separates the height half values from the lower half values of a data set. In this section, we will learn about what is median and how to find the median. MedianThe median is the mid-value or average of a data set. The data set must be sorted either in ascending or descending order. In other words, it is a middle value of a sorted data set. We find mean or average by using the median. How to Find MedianTo determine the median of a data set, the values of the data set must be sorted or arranged in either ascending or descending order. The data may be in two formats:
Ungrouped Frequency DistributionIn an ungrouped frequency distribution, the data may of two types:
When an odd number of the frequency distribution is given To find the median of odd frequency distribution follow the steps given below. But remember that data must be sorted. After sorting the data, use the following formula: 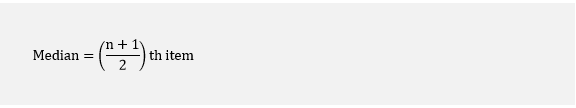
Where n is the total number of items in the data set. Another quick method to find the median is:
Let's understand the example of an odd frequency distribution. Example 1: Find the median of 23, 2, 12, 33, 65, 45, and 9. Solution: First, we sort the given data set. 2, 9, 12, 23, 33, 45, 65 There is a total of 7 values, so the mid-value (4th) will be median, i.e. 23. Similarly, we can find the median using the formula: 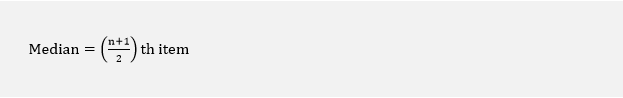
Putting the value of n in the formula, we get: 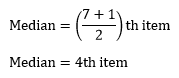
The 4th item or value will be median, i.e. 23. Hence, the median of the given data set is 23. When even number of the frequency distribution is given To find the median of the data set that contains even number of frequency distribution, we must follow the steps given below:
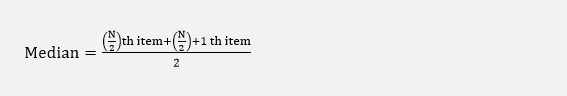
The value that we get on dividing is the median of the given data set. We can also write the above steps in terms of the formula: 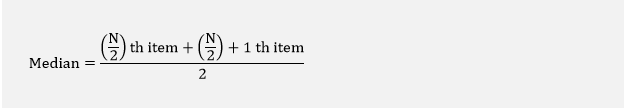
Where N is the total number of items in the data set. Let's understand the example of even frequency distribution. Example 2: Find the median of the following list: 1, 5, 77, 32, 65, 12, 44, 21, 90, 34, 8, 56, 4, 99 Solution: Step 1: Sort the given list. 1, 4, 5, 8, 12, 21, 32, 34, 44, 56, 65, 77, 90, 99 There are total 14 values in the list. Step 2: Find the middle pair and its values. The middle pair terms of the list are 7th and 8th and its values are 32 and 34, respectively. Step 3: Sum up the values and divide it by 2. 
A point to be noticed here is that 33 is not in the list. But it indicates that half values in the list are less than 33, and half values are greater than 33. Let's find the median through the formula which we have learned above. 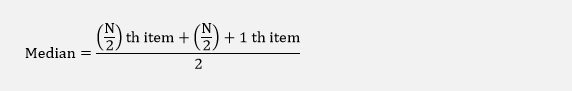
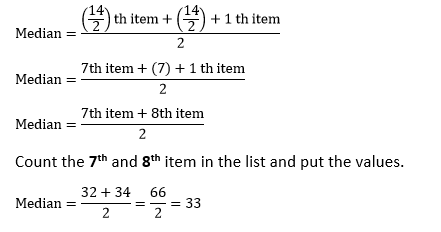
Hence, the median of the given list is 33. Example: In the following table, marks and number of students are given. Find the median.
Solution:
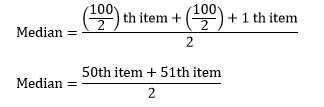
We see that there is no 50th and 51th item in the list. So, we have calculated the cumulative frequency (c.f). Therefore, the 50th item lies in:
So, we will take 28 as the 50th item, and 29 as the 51th item. Putting the values, we get: 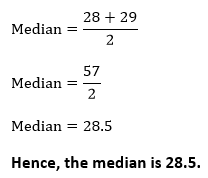
Grouped Frequency DistributionIn the grouped frequency distribution, the data are sorted and divided into groups called classes. The number of data items belonging to each class is called frequency. We denote it by the letter f. The grouped frequency distribution is also known as the continuous series. We must aware of the following two terms while dealing with grouped data.
To verify the cumulative frequency that you have calculated is correct or not, sum up the frequencies and match it with the last cumulative frequency. The last cumulative frequency and the sum of frequencies must be equal. Median Class: It is the class where middle position is located. In other words, the class where the half of the cumulative frequency or sum of frequencies lies is called the median class. The median class interval is the corresponding class where the median value lies. To find the median of ungrouped data, we must use the following formula. Formula 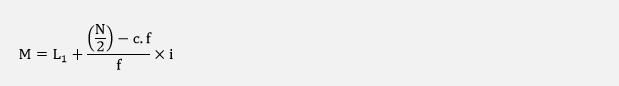
Where: M is the median. L1 is the lower limit of the median class. N is the total number of observations or sum of frequencies. c.f is the cumulative frequency of the class preceding the median class. f is the frequency of the median class. i is the class interval. Example 3: Find the median of the data given below:
Solution: First, we find the cumulative frequency (c. f).
Find the value of 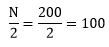
Let's see in which class the value 100 lies.
The value 100 lies in the above class. It is the median class. Now we will apply the formula: 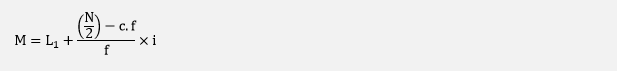
L1=25 (lower limit of the median class) 
c.f=77 (cumulative frequency of the class preceding the median class) f=42 (frequency of the median class) i=30-25=5 (class interval) Putting the values in the above formula, we get: 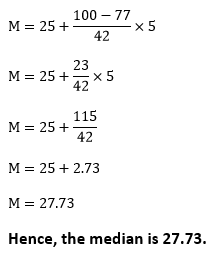
Next TopicHow to Divide Fractions
|
 .
. For Videos Join Our Youtube Channel: Join Now
Feedback
- Send your Feedback to [email protected]
Help Others, Please Share


