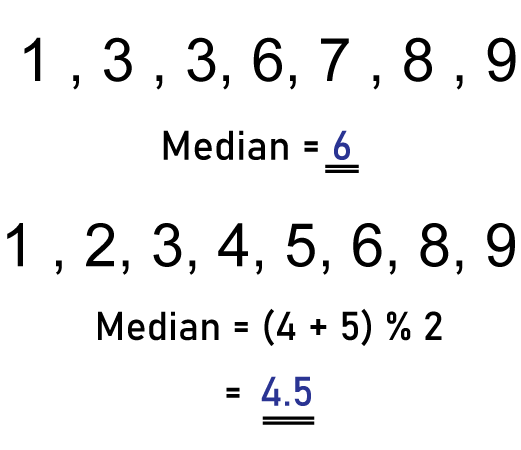
Median DefinitionThe median is a statistical measure of central tendency that represents the middle value in a set of data. It is a value that separates the lower 50% of the data from the upper 50%. In other words, the median is the value that is exactly in the middle of a dataset when the data is arranged in order. For example, if you have a dataset of numbers {1, 2, 3, 4, 5}, the median is 3, because it is the middle value of the set. If you have a dataset of numbers {1, 2, 3, 4}, the median is 2.5, because it is the value that is halfway between 2 and 3. 
The median is an important measure of central tendency because it is less sensitive to extreme values or outliers than the mean. This is because the median is based only on the position of the values in the dataset, not their magnitude. Therefore, the median is often used in situations where the data contains extreme values or when the distribution of the data is not symmetrical. Calculating the MedianTo calculate the median, you first need to arrange the data in order from lowest to highest or highest to lowest. If the data set contains an even number of values, the median is the average of the two middle values. If the data set contains an odd number of values, the median is the middle value. For example, if you have a dataset of numbers {1, 2, 3, 4, 5}, you would first arrange them in order: {1, 2, 3, 4, 5}. Since there are an odd number of values, the median is the middle value, which is 3. If you have a dataset of numbers {1, 2, 3, 4}, you would arrange them in order: {1, 2, 3, 4}. Since there are an even number of values, the median is the average of the two middle values, which are 2 and 3. Therefore, the median is 2.5. Uses of Median
Limitations of the Median
Despite its limitations, the median is a valuable tool in data analysis and is often used in conjunction with other measures of central tendency, such as the mean and mode. The mean, median, and mode provide complementary information about the central tendency of a dataset and can help provide a more complete picture of the data. In addition to its use in descriptive statistics, the median is also used in inferential statistics, particularly in hypothesis testing. Hypothesis testing is a statistical method used to determine whether a hypothesis is true or false based on sample data. The median is often used in nonparametric hypothesis testing, which does not make any assumptions about the distribution of the data. Nonparametric hypothesis testing is useful when the data is not normally distributed or when the sample size is small. In nonparametric hypothesis testing, the null hypothesis is typically that the median of the population is equal to a certain value. The test statistic is then calculated based on the difference between the sample median and the hypothesized median. The p-value is then calculated, which represents the probability of obtaining the observed test statistic if the null hypothesis is true. If the p-value is less than the significance level, the null hypothesis is rejected in favor of the alternative hypothesis. ConclusionIn conclusion, the median is a statistical measure of central tendency that represents the middle value in a set of data. It is less sensitive to extreme values than the mean and is often used in situations where the data contains outliers or extreme values. However, it has some limitations, such as the fact that it cannot be used with categorical data and that it does not take into account the magnitude of the values in the dataset. Despite these limitations, the median is a valuable tool in data analysis and is often used in conjunction with other measures of central tendency. It is also used in nonparametric hypothesis testing to test hypotheses about the median of a population.
Next TopicNormality Definition
|
 For Videos Join Our Youtube Channel: Join Now
Feedback
- Send your Feedback to [email protected]
Help Others, Please Share


