| |

NCERT Solutions Class 6 Maths Chapter - 9: Data HandlingExercise 9.11. In a Mathematics test, the following marks were obtained by 40 students. Arrange these marks in a table using tally marks. 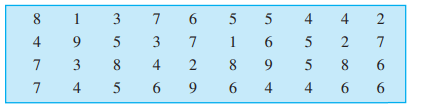
Answer: Here, we will first calculate the count of the repetition of each number given in the box. Count of 1 = 2 It means that there are 2 students who obtained marks 1. Similarly, Count of 2 = 3 Count of 3 = 3 Count of 4 = 7 Count of 5 = 6 Count of 6 = 6 Count of 7 = 5 Count of 8 = 4 Count of 9 = 3 Now, we will represent the above tally of the number of students in the form of a table, where a tally of five is represented as a four tallies with a cross line. 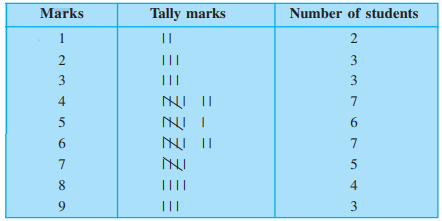
(a) Find how many students obtained marks equal to or more than 7. Answer: 12 Explanation: Students who obtained marks equal to or more than 7 = Number of students who obtained marks 7 + Number of students who obtained marks 8 + Number of students who obtained marks 9 Students who obtained marks equal to or more than 7 = 5 + 4 + 3 = 12 Thus, 12 numbers of students obtained marks equal to or more than 7. (b) How many students obtained marks below 4? Answer: 8 Explanation: Students who obtained marks below 4 = Students who obtained marks 3 + Students who obtained marks 2 + Students who obtained marks 1 = 3 + 3 + 2 = 8 Thus, 8 numbers of students obtained marks below 4. 2. Following is the choice of sweets of 30 students of Class VI. Ladoo, Barfi, Ladoo, Jalebi, Ladoo, Rasgulla, Jalebi, Ladoo, Barfi, Rasgulla, Ladoo, Jalebi, Jalebi, Rasgulla, Ladoo, Rasgulla, Jalebi, Ladoo, Rasgulla, Ladoo, Ladoo, Barfi, Rasgulla, Rasgulla, Jalebi, Rasgulla, Ladoo, Rasgulla, Jalebi, Ladoo. (a) Arrange the names of sweets in a table using tally marks. Answer: Here, we will first find the count of each sweet from the give list of sweets. The tally will be calculated on the basis of students choosing a specific sweet. Count of Ladoo = 11 Count of Barfi = 3 Count of Jalebi = 7 Count of Rasgulla = 9 Now, we will represent the above tally of the number of students in the form of a table, where a tally of five is represented as a four tallies with a cross line. 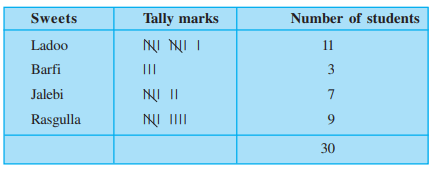
Total count of sweets = 11 + 3 + 7 + 9 = 30 (b) Which sweet is preferred by most of the students? Answer: Ladoo Explanation: The sweet with the maximum tally count is preferred by most of the students. In the above table, Ladoo has the maximum count. Thus, Ladoo is preferred by most of the students. 3. Catherine threw a dice 40 times and noted the number appearing each time as shown below: 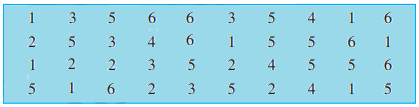
Make a table and enter the data using tally marks. Answer: Here, we will first calculate the count of the repetition of each number given in the box. Count of 1 = 7 It means that a number 1 was repeated 7 times when Catherine threw a dice 40 times. Similarly, Count of 2 = 6 Count of 3 = 5 Count of 4 = 4 Count of 5 = 11 Count of 6 = 7 Now, we will represent the above tally of the number of count of different numbers on a dice in the form of a table, where a tally of five is represented as a four tallies with a cross line. 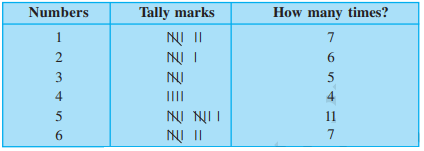
Find the number that appeared. (a) The minimum number of times Answer: 4 Explanation: The number with the least count appears the minimum number of times. Thus, number 4 appeared the minimum number of times. (b) The maximum number of times Answer: 5 Explanation: The number with the highest count appears the maximum number of times. Thus, number 5 appeared the maximum number of times. (c) Find those numbers that appear an equal number of times. Answer: 1 and 6 Explanation: 1 and 6 appeared equal number of times, i.e., 7 times. 4. Following pictograph shows the number of tractors in five villages. Observe the pictograph and answer the following questions. 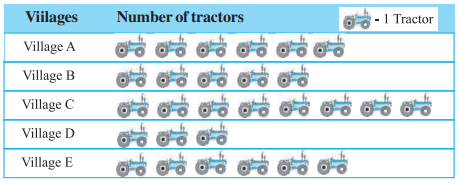
Count of tractors in village A = 6 Count of tractors in village B = 5 Count of tractors in village C = 8 Count of tractors in village D = 3 Count of tractors in village E = 6 (i) Which village has the minimum number of tractors? Answer: Village D Explanation: Village D has the count of 3 tractors, which is the least number of tractors as compared to all the villages. Thus, village D has the minimum number of tractors. (ii) Which village has the maximum number of tractors? Answer: Village C Explanation: Village C has the count of 8 tractors, which is the highest number of tractors as compared to all the villages. Thus, village C has the maximum number of tractors. (iii) How many more tractors village C has as compared to village B. Answer: 3 Explanation: Total number of tractors in village C = 8 Total number of tractors in village B = 5 Difference = 8 - 5 = 3 Thus, village C has 3 more tractors as compared to village B. (iv) What is the total number of tractors in all the five villages? Answer: 28 Explanation: Total number of tractors in all the five villages = Tractors in village A + Tractors in village B + Tractors in village C + Tractors in village D + Tractors in village E = 6 + 5 + 8 + 3 + 6 = 28 Thus, there are total 28 tractors in all the five villages. 5. The number of girl students in each class of a co-educational middle school is depicted by the pictograph: Observe this pictograph and answer the following questions: 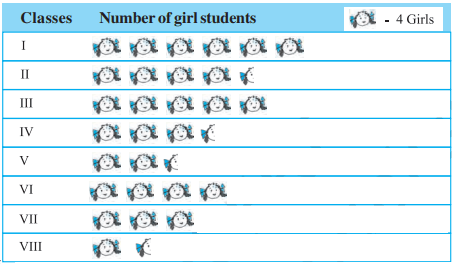
Explanation: The above table shows that 1 girl student is equal to four girls. A half girl in the above table = 4/2 = 2 girls Thus, the number of girl students in different classes will be: Class I = 6 girl pictures 1 picture = 4 girls Number of girls in class I = 4× 6 = 24 Class I girls = 24 Similarly, Class II girls = 4× 4 + 4 × ½ Class II girls = 18 Class III girls = 5 × 4 = 20 Class IV girls = 3 × 4 + 4 × ½ = 14 Class V girls = 4× 2 + 4 × ½ = 10 Class VI girls = 4 × 4 = 16 Class VII girls = 4 × 3 = 12 Class VIII girls = = 4× 1 + 4 × ½ = 6 (a) Which class has the minimum number of girl students? Answer: Class VIII Explanation: Class VIII has the count of 6 girls, which is the least number as compared to the girls in all the classes. Thus, class VIII has the minimum number of girl students. (b) Is the number of girls in Class VI less than the number of girls in Class V? Answer: No Explanation: Number of girls is class VI = 16 Number of girls in class V = 10 Thus, Class VI has 6 more girls as compared to the class V. (c) How many girls are there in Class VII? Answer: 12 Explanation: Number of girl pictures in class VII = 3 1 girl picture = 4 girls 3 girl pictures = 4 × 3 = 12 girls Thus, there are 12 numbers of girls students in Class VII. 6. The sale of electric bulbs on different days of a week is shown below: 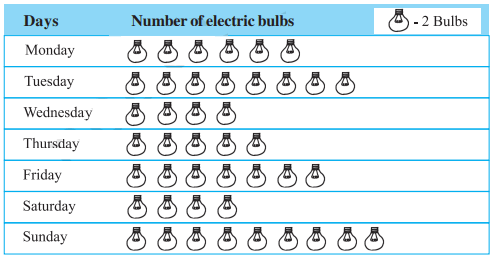
Explanation: 1 bulb picture = 2 bulbs Number of electric bulbs sold on Monday = 6 bulb pictures = 6× 2 = 12 Number of electric bulbs sold on Monday = 12 Similarly, Number of electric bulbs sold on Tuesday = 8× 2 = 16 Number of electric bulbs sold on Wednesday = 4× 2 = 8 Number of electric bulbs sold on Thursday = 5× 2 = 10 Number of electric bulbs sold on Friday = 7× 2 = 14 Number of electric bulbs sold on Saturday = 4× 2 = 8 Number of electric bulbs sold on Sunday = 9× 2 = 18 Observe this pictograph and answer the following questions: (a) How many bulbs were sold on Friday? Answer: 14 Explanation: 1 bulb picture = 2 bulbs Number of electric bulbs sold on Friday = 7 bulb pictures = 7× 2 = 14 Thus, 14 bulbs were sold on Friday. (b) On which day were the maximum numbers of bulbs sold? Answer: Sunday Explanation: 18 numbers of bulbs were sold on Sunday. (c) On which of the days same numbers of bulbs were sold? Answer: Wednesday and Saturday Explanation: 8 numbers of bulbs were sold on Wednesday and Saturday. (d) On which of the days minimum numbers of bulbs were sold?< Answer: Wednesday and Saturday Explanation: Count 8 is the minimum number of bulbs sold as compared to the bulbs sold on different days. 8 numbers of bulbs were sold on Wednesday and Saturday, which is the least number. (e) If one big carton can hold 9 bulbs. How many cartons were needed in the given week? Answer: 10 cartons Explanation: 1 big carton can hold 9 bulbs. Total bulbs sold in a week = Bulbs sold on all the seven days of a week = 12 + 16 + 8 + 10 + 14 + 8 + 18 = 86 The cartons required to hold 86 bulbs = 86/9 = 9.55 = 10 (approx.) Thus, 10 cartons are required to hold all the bulbs in a given week. 7. In a village six fruit merchants sold the following number of fruit baskets in a particular season: 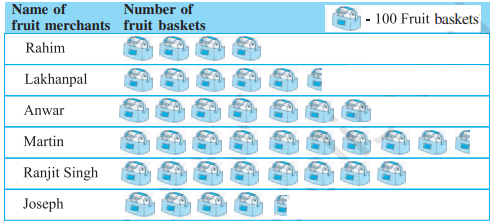
Explanation: 1 fruit basket picture = 100 fruit baskets Half fruit basket = 100 × 1/2 = 50 fruit baskets Number of fruit baskets sold by Rahim = 4 fruit baskets = 4× 100 = 400 Number of fruit baskets sold by Lakhanpal = 5× 100 + ½ × 100 = 500 + 50 = 550 Number of fruit baskets sold by Anwar = 7× 100 = 700 Number of fruit baskets sold by Martin = 9× 100 + ½ × 100 = 900 + 50 = 950 Number of fruit baskets sold by Ranjit Singh = 8× 100 = 800 Number of fruit baskets sold by Joseph = 4× 100 + ½ × 100 = 400 + 50 = 450 Observe this pictograph and answer the following questions: (a) Which merchant sold the maximum number of baskets? Answer: Martin Explanation: Martin sold the maximum number of baskets, which is equal to 950. 1 fruit basket picture = 100 fruit baskets Half fruit basket = 100 × 1/2 = 50 fruit baskets Number of fruit baskets sold by Martin = 9× 100 + ½ × 100 = 900 + 50 = 950 (b) How many fruit baskets were sold by Anwar? Answer: 700 Explanation: 1 fruit basket picture = 100 fruit baskets Number of fruit baskets sold by Anwar = 7× 100 = 700 (c) The merchants who have sold 600 or more number of baskets are planning to buy a go-down for the next season. Can you name them? Answer: Anwar, Martin, and Ranjit Singh Explanation: 1 fruit basket picture = 100 fruit baskets Half fruit basket = 100 × 1/2 = 50 fruit baskets Number of fruit baskets sold by Anwar = 7× 100 = 700 Number of fruit baskets sold by Martin = 9× 100 + ½ × 100 = 900 + 50 = 950 Number of fruit baskets sold by Ranjit Singh = 8× 100 = 800 Exercise 9.21. Total numbers of animals in five villages are as follows: Village A: 80 Village B: 120 Village C: 90 Village D: 40 Village E: 60 Prepare a pictograph of these animals using one symbol to represent 10 animals and answer the following questions: Answer: The pictograph is represented as follows: 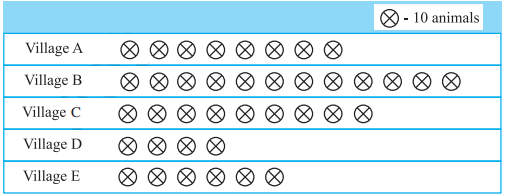
Where, One symbol = 10 animals Number of symbols representing village A = 80/10 = 8 Number of symbols representing village B = 120/10 = 12 Number of symbols representing village C = 90/10 = 9 Number of symbols representing village D = 40/10 = 4 Number of symbols representing village E = 60/10 = 6 (a) How many symbols represent animals of village E? Answer: 6 Explanation: Number of symbols representing village E = 60/10 = 6 (b) Which village has the maximum number of animals? Answer: Village B Explanation: Village B has the maximum number of animals equal to 120. (c) Which village has more animals: village A or village C? Answer: Village C Explanation: Village A has 80 numbers of animals, while village C has 90 numbers of animals. Difference = 90 - 80 = 10 Thus, village C has 10 more animals as compared to the village A. 2. Total number of students of a school in different years is shown in the following table.
A. Prepare a pictograph of students using one symbol to represent 100 students and answer the following questions: Answer: The pictograph is represented as follows: 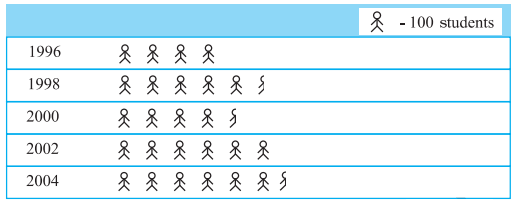
Explanation: Here, 1 symbol = 100 students Half symbol = 100/2 = 50 students Number of symbols representing year 1996 = 400/100 = 4 Number of symbols representing year 1998 = 535/100 = 5.35 = 5 + 0.35 = 5 full symbols + A little less than the half symbol The symbol of the year 1998 will be represented as a little less than the half symbol because its value (0.35) is less than the half value (0.5). Number of symbols representing year 2000 = 472/100 = 4.72 = 4 + 0.72 = 4 full symbols + a little more than the half symbol Number of symbols representing year 2002 =600/100 = 6 Number of symbols representing year 2004 = 623/100 = 6.23 = 6 + 0.23 = 6 full symbols + A little less than the half symbol (a) How many symbols represent total number of students in the year 2002? Answer: 6 Explanation: 1 symbol = 100 students Total number of students in the year 2002 = 600 Number of symbols representing year 2002 =600/100 = 6 (b) How many symbols represent total number of students for the year 1998? Answer: 5 complete and 1 incomplete Explanation: 1 symbol = 100 students Half symbol = 100/2 = 50 students Number of symbols representing year 1998 = 535/100 = 5.35 = 5 + 0.35 = 5 full symbols + A little less than the half symbol The symbol of the year 1998 will be represented as a little less than the half symbol because its value (0.35) is less than the half value (0.5). B. Prepare another pictograph of students using any other symbol each representing 50 students. Which pictograph do you find more informative? Answer: The pictograph is represented as follows: 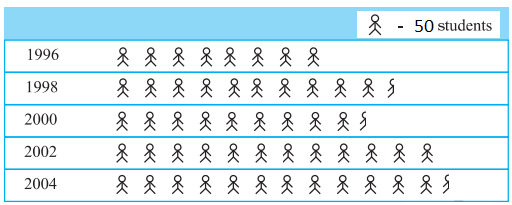
Explanation: Here, 1 symbol = 50 students Half symbol = 50/2 = 25 students Number of symbols representing year 1996 = 400/50 = 8 Number of symbols representing year 1998 = 535/50 = 10.7 = 10 + 0.7 = 10 full symbols + a little more than the half symbol The symbol of the year 1998 will be represented as a little more than the half symbol because its value (0.7) is more than the half value (0.5). Number of symbols representing year 2000 = 472/50 = 9.44 = 9 + 0.44 = 9 full symbols + a little less than the half symbol Number of symbols representing year 2002 =600/50 = 12 Number of symbols representing year 2004 = 623/50 = 12.46 = 12 + 0.46 = 12 full symbols + a half symbol 0.46 can be approximated to 0.5, which is the half symbol. The second pictograph is found to be more informative because the size is small. Any graph with the smaller size always is more informative. Exercise 9.31. The bar graph given alongside shows the amount of wheat purchased by government during the year 1998-2002. Read the bar graph and write down your observations. 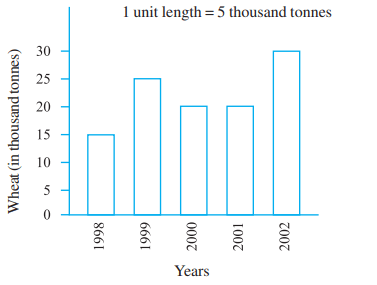
Explanation: The following observations can be noted from the above graph. Wheat purchased in the year 1998 = 15 thousand tonnes Wheat purchased in the year 1999 = 25 thousand tonnes Wheat purchased in the year 2000 = 20 thousand tonnes Wheat purchased in the year 2001 = 20 thousand tonnes Wheat purchased in the year 2002 = 30 thousand tonnes In which year was: (a) The wheat production maximum? Answer: 2002 Explanation: Wheat purchased in the year 2002 = 30 thousand tonnes It is the maximum wheat production as compared to the other years given in the graph. (b) The wheat production minimum? Answer: 1998 Explanation: Wheat purchased in the year 1998 = 15 thousand tonnes It is the minimum wheat production as compared to the other years given in the graph. 2. Observe this bar graph which is showing the sale of shirts in a readymade shop from Monday to Saturday. Now answer the following questions: 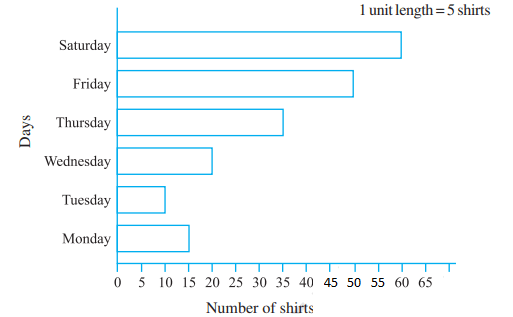
Number of shirts sold 1 unit length = 5 shirts Explanation: Shirts sold on Monday = 15 Shirts sold on Tuesday = 10 Shirts sold on Wednesday = 20 Shirts sold on Thursday = 35 Shirts sold on Friday = 50 Shirts sold on Saturday = 60 (a) What information does the above bar graph give? Answer: The graph provides the information on the shirts sold on the days of a week, Monday, Tuesday, Wednesday, Thursday, Friday, and Saturday. (b) What is the scale chosen on the horizontal line representing number of shirts? Answer: 1 unit length = 5 shirts (c) On which day were the maximum numbers of shirts sold? How many shirts were sold on that day? Answer: Saturday, 60 Explanation: The maximum numbers of shirts were sold on Saturday, which is equal to 60. It is the maximum count of shirts as compared to the other shirts sold on the different days. (d) On which day were the minimum numbers of shirts sold? Answer: Tuesday Explanation: The minimum numbers of shirts were sold on Tuesday, which is equal to 10. It is the minimum count of shirts as compared to the other shirts sold on the different days. (e) How many shirts were sold on Thursday? Answer: 35 Explanation: Shirts sold on Thursday = 35 3. Observe this bar graph which shows the marks obtained by Aziz in half-yearly examination in different subjects. Answer the given questions. 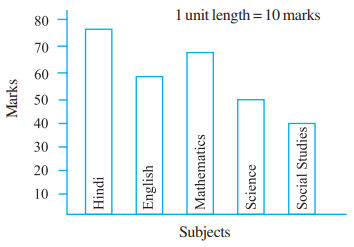
Explanation: Marks scored by Aziz in Hindi = 80 (approx.) Marks scored by Aziz in English = 60 (approx.) Marks scored by Aziz in Mathematics = 70 (approx.) Marks scored by Aziz in Science = 50 Marks scored by Aziz in Social Studies = 40 (a) What information does the bar graph give? Answer: The bar graph gives the information about the marks obtained by Aziz in half-yearly examination in different subjects. (b) Name the subject in which Aziz scored maximum marks. Answer: Hindi Explanation:Aziz scored maximum marks in Hindi, which is approximately equal to 80. (c) Name the subject in which he has scored minimum marks. Answer: Social Studies Explanation: Aziz scored minimum marks in Social Studies, which is approximately equal to 40. (d) State the name of the subjects and marks obtained in each of them. Answer: Hindi = 80 English = 60 Mathematics = 70 Science = 50 Social Studies = 40 Exercise 9.41. A survey of 120 school students was done to find which activity they prefer to do in their free time.
Draw a bar graph to illustrate the above data taking scale of 1 unit length = 5 students. Answer: The bar graph is shown below: 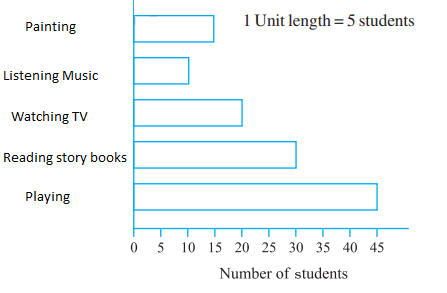
Where, 1 unit length = 5 students Which activity is preferred by most of the students other than playing? Answer: Playing Reading story books is preferred by most of thestudents other than playing. 2. The number of Mathematics books sold by a shopkeeper on six consecutive days is shown below:
Draw a bar graph to represent the above information choosing the scale of your choice. 1 unit length = 200 rupees Answer: The bar graph is shown below: 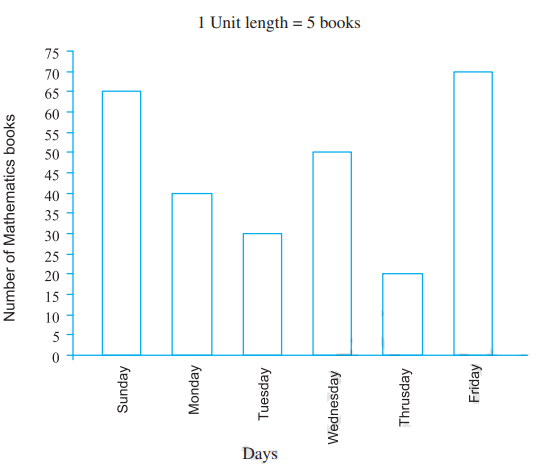
3. Following table shows the number of bicycles manufactured in a factory during the years 1998 to 2002. Illustrate this data using a bar graph. Choose a scale of your choice.
Answer: The bar graph is shown below: 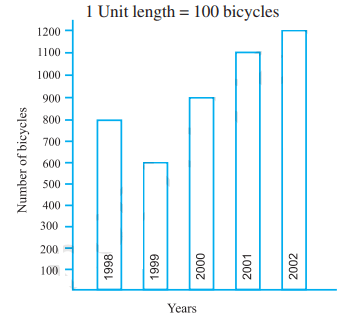
(a) In which year were the maximum numbers of bicycles manufactured? Answer: 2002 Explanation: The maximum numbers of bicycles were manufactured in the year 2002, which is equal to 1200. (b) In which year were the minimum numbers of bicycles manufactured? Answer: 1999 Explanation: The minimum numbers of bicycles were manufactured in the year 1999, which is equal to 600. Number of persons in various age groups in a town is given in the following table.
Draw a bar graph to represent the above information and answer the following questions. (Take 1 unit length = 20 thousands) Answer: The bar graph is shown below: 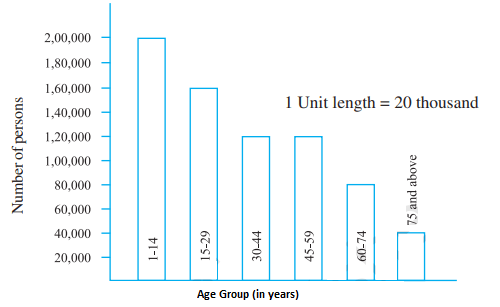
Explanation: Where, (a) Which two age groups have same population? Answer: 30-44 and 45-59 Explanation: Age groups 30-44 and 45-59 have the same population, which is equal to 1,20,000. (b) All persons in the age group of 60 and above are called senior citizens. How many senior citizens are there in the town? Answer: 1 lakh 20 thousands Explanation: Senior citizens = Age group of 60 and above Senior citizens = Age group of 60-74 + age group of 75 and above = 80,000 + 40,000 = 1,20,000 Thus, the persons in the age group of 60 and above are equal to 1 lakh 20 thousands.
Next TopicNCERT Solutions Class 6 Maths Chapter 10
|
 For Videos Join Our Youtube Channel: Join Now
Feedback
- Send your Feedback to [email protected]
Help Others, Please Share


