| |

Non-linear Function in Discrete mathematicsOn the basis of the name of a non-linear function, it is a function that is NOT linear. The non-linear function can be described as a function that does not create a line on the graph. The graph of a non-linear function will be anything but not a line. In this section, we will learn about the definition, graph, and examples of the non-linear function. What is a non-linear Function?A non-linear function can be described as a function that does not draw a straight line on the graph. The graph of a non-linear function can be a curve, but it must not be a line. For example: If we have a pound that has 100 fish in the starting and every week the fishes become double, in this case, we can model this situation with the help of function f(x) like f(x) = 100 (2)x, where f(x) is used to indicate the number of fishes, and x is used to indicate the number of weeks. Now we can make a table and graph of this function, which is described as follows:
Now we will graph the above table, which is described as follows: 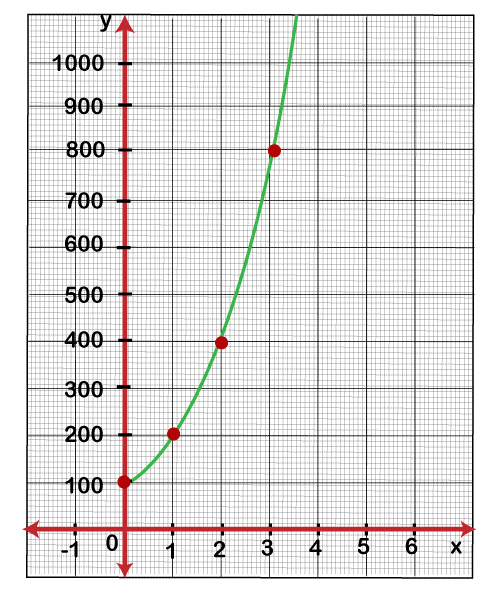
In the above graph, we can see that there is NO straight line. Hence this graph has a non-linear function. In the above graph of a non-function, there is no uniform way in the slope of this graph. We can show a non-linear function with the help of a table of values, an equation, or a graph. Now we will learn each of them. There are some examples of non-linear functions, i.e., polynomial functions, cubic functions, quadratic functions, etc. Table of Non-linear functionThere are some steps that are used to find whether a table of values finds a linear function or not. These steps are described as follows: Step 1: In this step, we will determine the difference between every two consecutive x values. Step 2: In this step, we will determine the difference between every two consecutive y values. Step 3: In this step, we will determine the corresponding ratios of differences of y and differences of x. Step 4: The function will be linear only if the ratios calculated in step 3 are not the same. To understand this, we will consider a table of values, which is described as follows:
Now we will use the above steps and find out whether the above table shows a non-linear function. 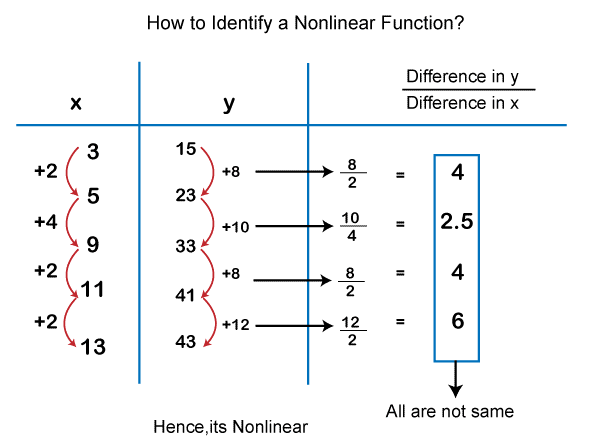
The function is non-linear because there is not the same number of ratios between the differences of y to the differences of x. Equation of Non-linear functionA linear function is used to contain the form f(x) = ax+b. Since a linear function can be described as a function that will not be linear. The non-linear equation can contain any type of form, but that form must not be f(x) = ax+b. There are various examples of non-linear functions, and some of them are described as follows:
Graphs of Non-linear FunctionIf there is a function that is not linear, then it will be known as the non-linear function. A non-linear function will be represented by those types of functions that do not generate a straight line in the graph. In the following graphs, we can see that there is no straight line in all the images. All the graphs show the non-linear function. 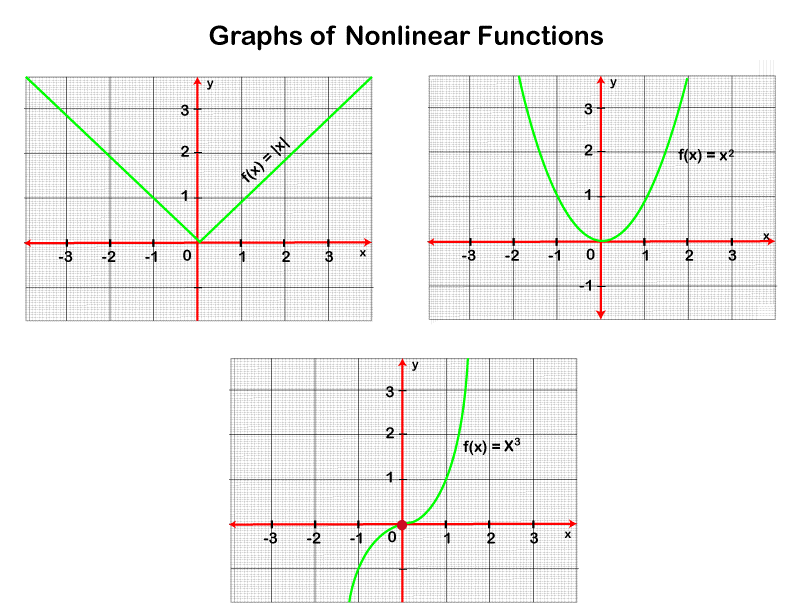
Linear and Non-linear FunctionsThe linear and non-linear functions contain a lot of differences, which are described as follows:
Important points of Non-linear function
Examples of Non-linearThe no-linear is used to contain the various examples, and some of them are described as follows: Example 1: In this example, there are three functions, and we have to determine which function is non-linear. These functions are described as follows:
Solution:
Hence, only (2) and (3) both are non-linear functions. Example 2: In this example, we have a table with some values, and we have to show whether this table shows a linear function or not. The table is described as follows:
Solution: As we can see, 1, 1, 1, and 1 are the differences between every two successive values of x. Similarly, -2500, -1250, -625, and -312.5 are the differences between every two successive values of y. The ratio between the x values and y values are -2500, -1250, -625, and -312.5, and these values are not the same. Therefore, we can say that the function which is shown in the above table is non-linear. Hence, this table is non-linear. Example 3: In this example, there are four graphs, and we have to show whether they show non-linear or not. 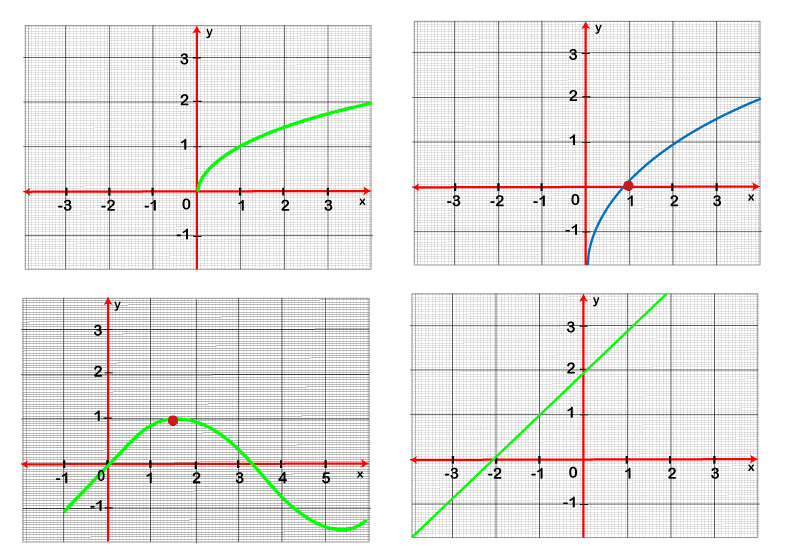
Solution: According to the definition of a non-linear function, the graph of a non-linear function must not be a line. Graph numbers (a), (b), and (c) do not contain a straight line, whereas graph (d) contains a straight line. So we can say that graphs (a), (b), and (c) are non-linear graphs, but graph (d) is not a non-linear graph or a linear graph.
Next TopicLexicographic Orders
|
 For Videos Join Our Youtube Channel: Join Now
Feedback
- Send your Feedback to [email protected]
Help Others, Please Share


