| |

OLAP Operations in the Multidimensional Data ModelIn the multidimensional model, the records are organized into various dimensions, and each dimension includes multiple levels of abstraction described by concept hierarchies. This organization support users with the flexibility to view data from various perspectives. A number of OLAP data cube operation exist to demonstrate these different views, allowing interactive queries and search of the record at hand. Hence, OLAP supports a user-friendly environment for interactive data analysis. Consider the OLAP operations which are to be performed on multidimensional data. The figure shows data cubes for sales of a shop. The cube contains the dimensions, location, and time and item, where the location is aggregated with regard to city values, time is aggregated with respect to quarters, and an item is aggregated with respect to item types. Roll-UpThe roll-up operation (also known as drill-up or aggregation operation) performs aggregation on a data cube, by climbing down concept hierarchies, i.e., dimension reduction. Roll-up is like zooming-out on the data cubes. Figure shows the result of roll-up operations performed on the dimension location. The hierarchy for the location is defined as the Order Street, city, province, or state, country. The roll-up operation aggregates the data by ascending the location hierarchy from the level of the city to the level of the country. When a roll-up is performed by dimensions reduction, one or more dimensions are removed from the cube. For example, consider a sales data cube having two dimensions, location and time. Roll-up may be performed by removing, the time dimensions, appearing in an aggregation of the total sales by location, relatively than by location and by time. ExampleConsider the following cubes illustrating temperature of certain days recorded weekly:
Consider that we want to set up levels (hot (80-85), mild (70-75), cool (64-69)) in temperature from the above cubes. To do this, we have to group column and add up the value according to the concept hierarchies. This operation is known as a roll-up. By doing this, we contain the following cube:
The roll-up operation groups the information by levels of temperature. The following diagram illustrates how roll-up works. 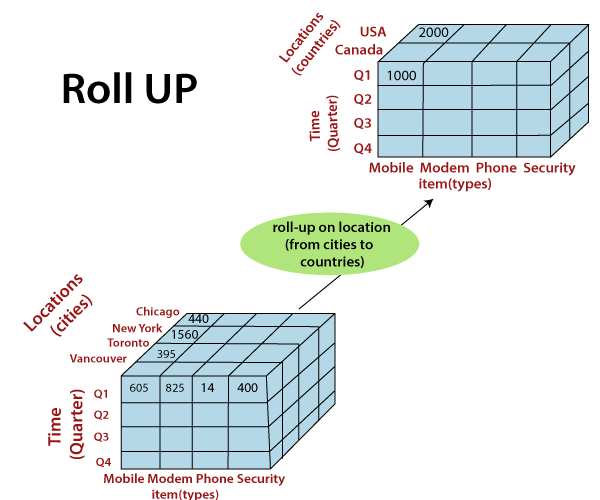
Drill-DownThe drill-down operation (also called roll-down) is the reverse operation of roll-up. Drill-down is like zooming-in on the data cube. It navigates from less detailed record to more detailed data. Drill-down can be performed by either stepping down a concept hierarchy for a dimension or adding additional dimensions. Figure shows a drill-down operation performed on the dimension time by stepping down a concept hierarchy which is defined as day, month, quarter, and year. Drill-down appears by descending the time hierarchy from the level of the quarter to a more detailed level of the month. Because a drill-down adds more details to the given data, it can also be performed by adding a new dimension to a cube. For example, a drill-down on the central cubes of the figure can occur by introducing an additional dimension, such as a customer group. ExampleDrill-down adds more details to the given data
The following diagram illustrates how Drill-down works. 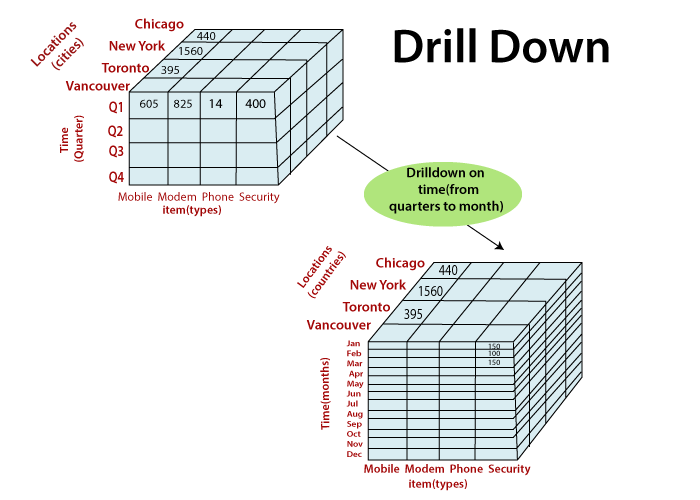
SliceA slice is a subset of the cubes corresponding to a single value for one or more members of the dimension. For example, a slice operation is executed when the customer wants a selection on one dimension of a three-dimensional cube resulting in a two-dimensional site. So, the Slice operations perform a selection on one dimension of the given cube, thus resulting in a subcube. For example, if we make the selection, temperature=cool we will obtain the following cube:
The following diagram illustrates how Slice works. 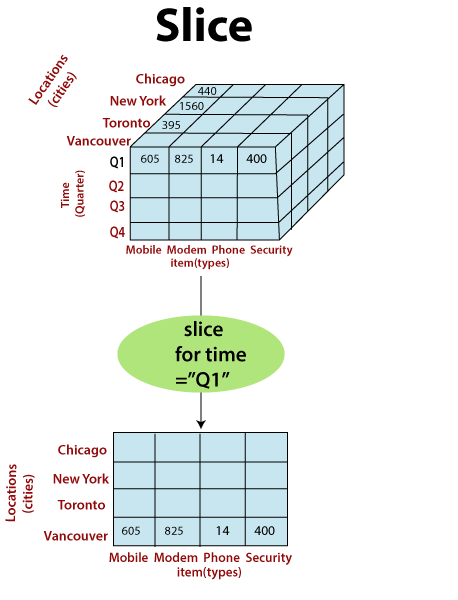
Here Slice is functioning for the dimensions "time" using the criterion time = "Q1". It will form a new sub-cubes by selecting one or more dimensions. DiceThe dice operation describes a subcube by operating a selection on two or more dimension. For example, Implement the selection (time = day 3 OR time = day 4) AND (temperature = cool OR temperature = hot) to the original cubes we get the following subcube (still two-dimensional)
Consider the following diagram, which shows the dice operations. 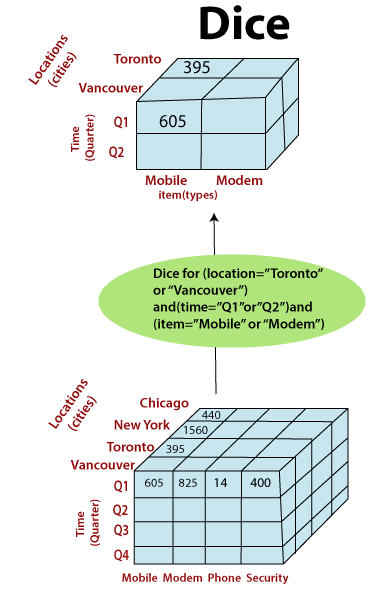
The dice operation on the cubes based on the following selection criteria involves three dimensions.
PivotThe pivot operation is also called a rotation. Pivot is a visualization operations which rotates the data axes in view to provide an alternative presentation of the data. It may contain swapping the rows and columns or moving one of the row-dimensions into the column dimensions. 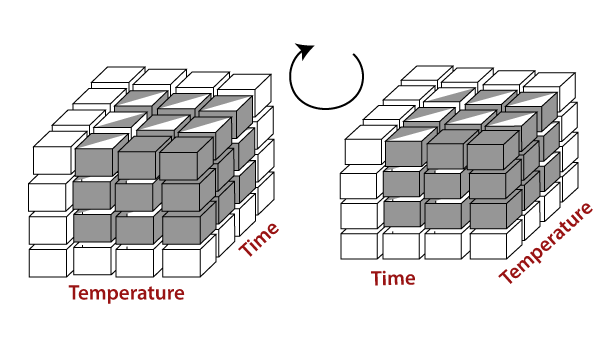
Consider the following diagram, which shows the pivot operation. 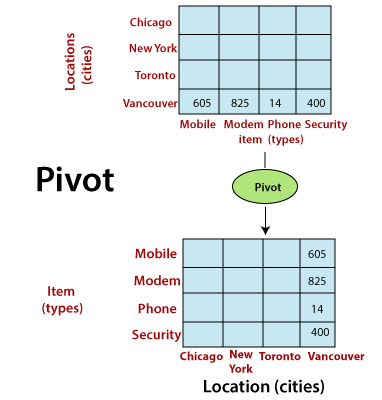
Other OLAP Operationsexecutes queries containing more than one fact table. The drill-through operations make use of relational SQL facilitates to drill through the bottom level of a data cubes down to its back-end relational tables. Other OLAP operations may contain ranking the top-N or bottom-N elements in lists, as well as calculate moving average, growth rates, and interests, internal rates of returns, depreciation, currency conversions, and statistical tasks. OLAP offers analytical modeling capabilities, containing a calculation engine for determining ratios, variance, etc. and for computing measures across various dimensions. It can generate summarization, aggregation, and hierarchies at each granularity level and at every dimensions intersection. OLAP also provide functional models for forecasting, trend analysis, and statistical analysis. In this context, the OLAP engine is a powerful data analysis tool.
Next TopicTypes of OLAP
|
 For Videos Join Our Youtube Channel: Join Now
Feedback
- Send your Feedback to [email protected]
Help Others, Please Share


