| |

One-Way ANOVA Summary Table in SPSSIn this section, we will discuss the ANOVA summary table. This table is known as the ANOVA summary table because it gives us a summary of the ANOVA calculation. When we calculate one way ANOVA, we are going to have two group differences. One is Between Group differences, and another is Within Group differences. 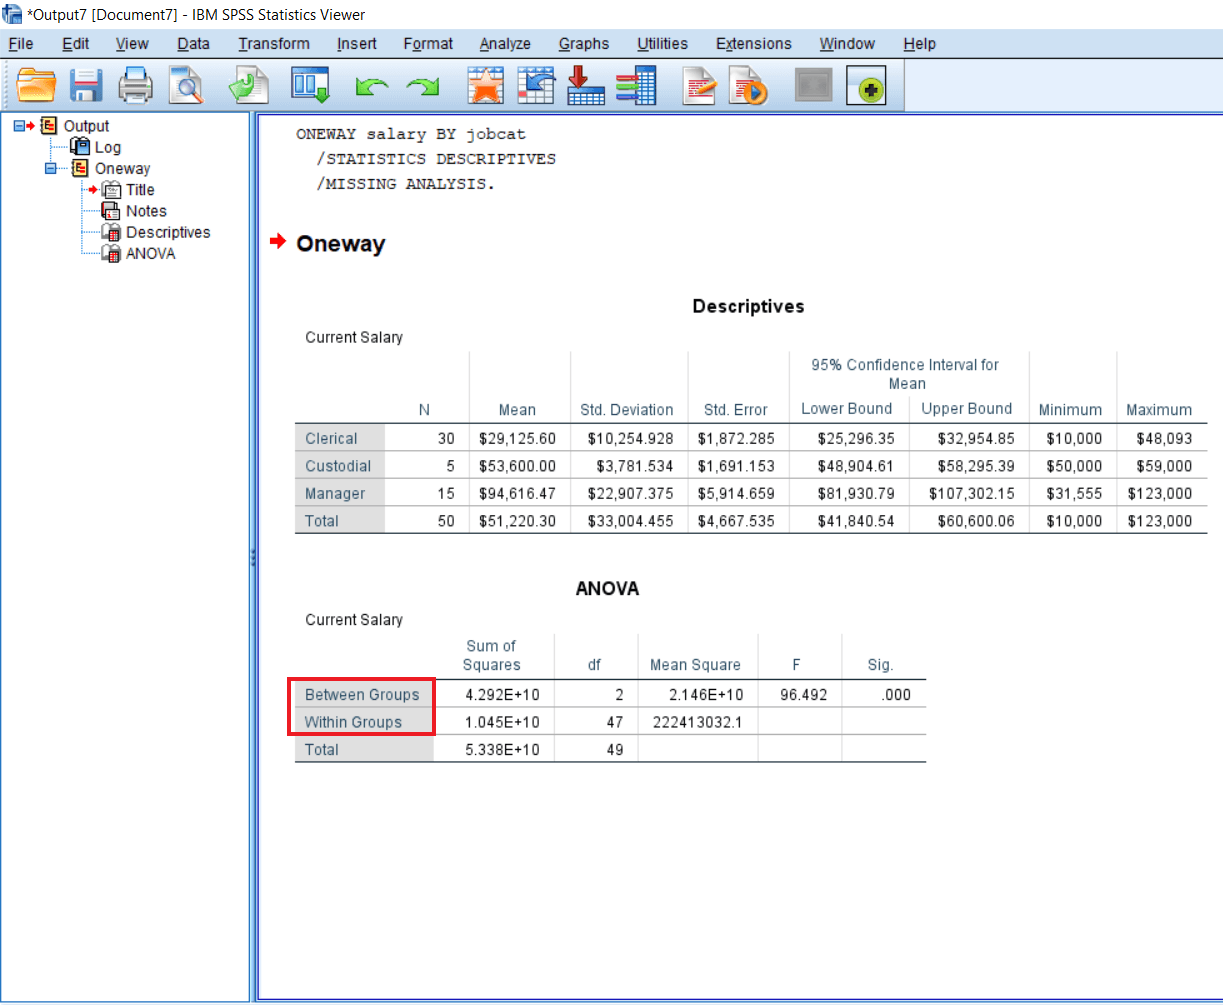
Between means these three groups or three different job category Clerk Vs. Custodial Vs. Manager. Between-group differences mean comparing the variances from Clerk to Custodial Vs. Clerk to Manager and Custodial Vs. Manager. The Sum of square of between-group is 4.292E+10. Within-group refers to a comparison of variances with groups, i.e., what is a variation of salary amongst clerks. So the variance for Within-group comparison is 1.054E+10. 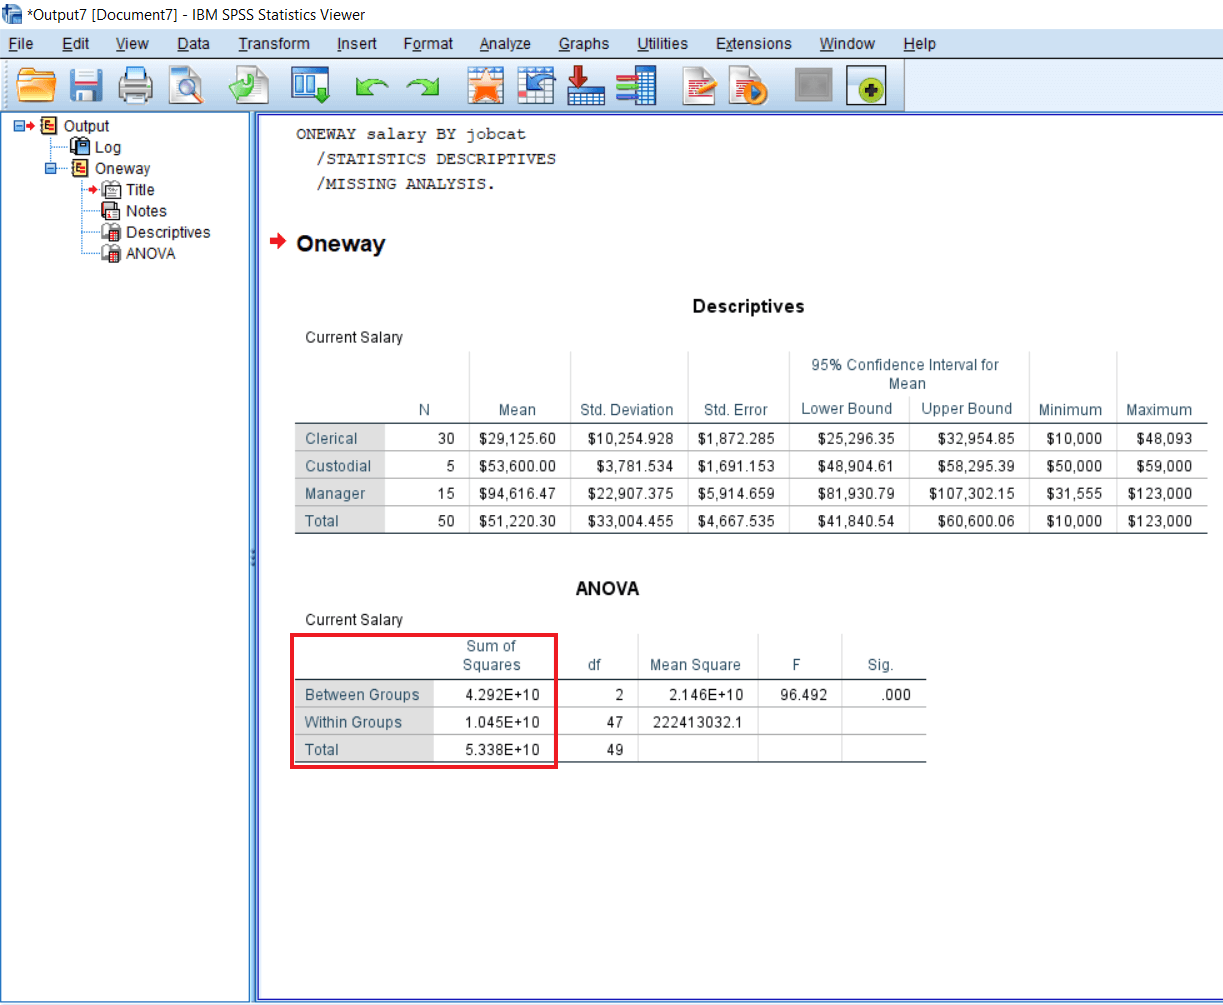
The Degree of freedom of between-group is 2 because we have three groups, so the degree of freedom is 3-1, i.e., 2. For the within-group degree of freedom, we deduct 1 from each group. So we deduct from 30-1 + 5-1 + 15-1, and we get the 47. 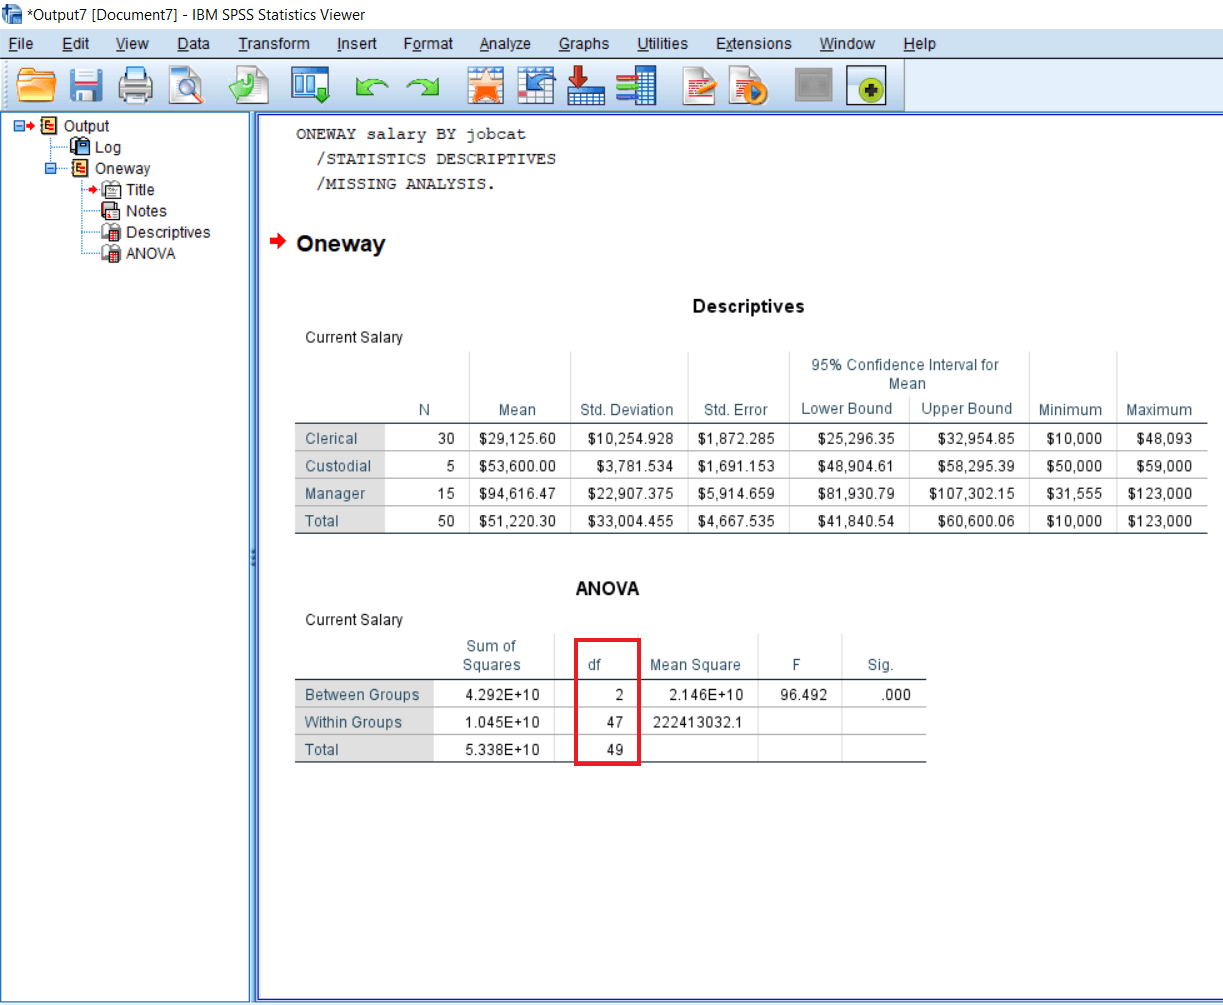
Mean square is nothing but a ratio of the Sum of a square divided by Degree of freedom. If we divide 4.292 by 2, we will get 2.146, and if we divide 1.045 by 47, we will get 222413032.1. 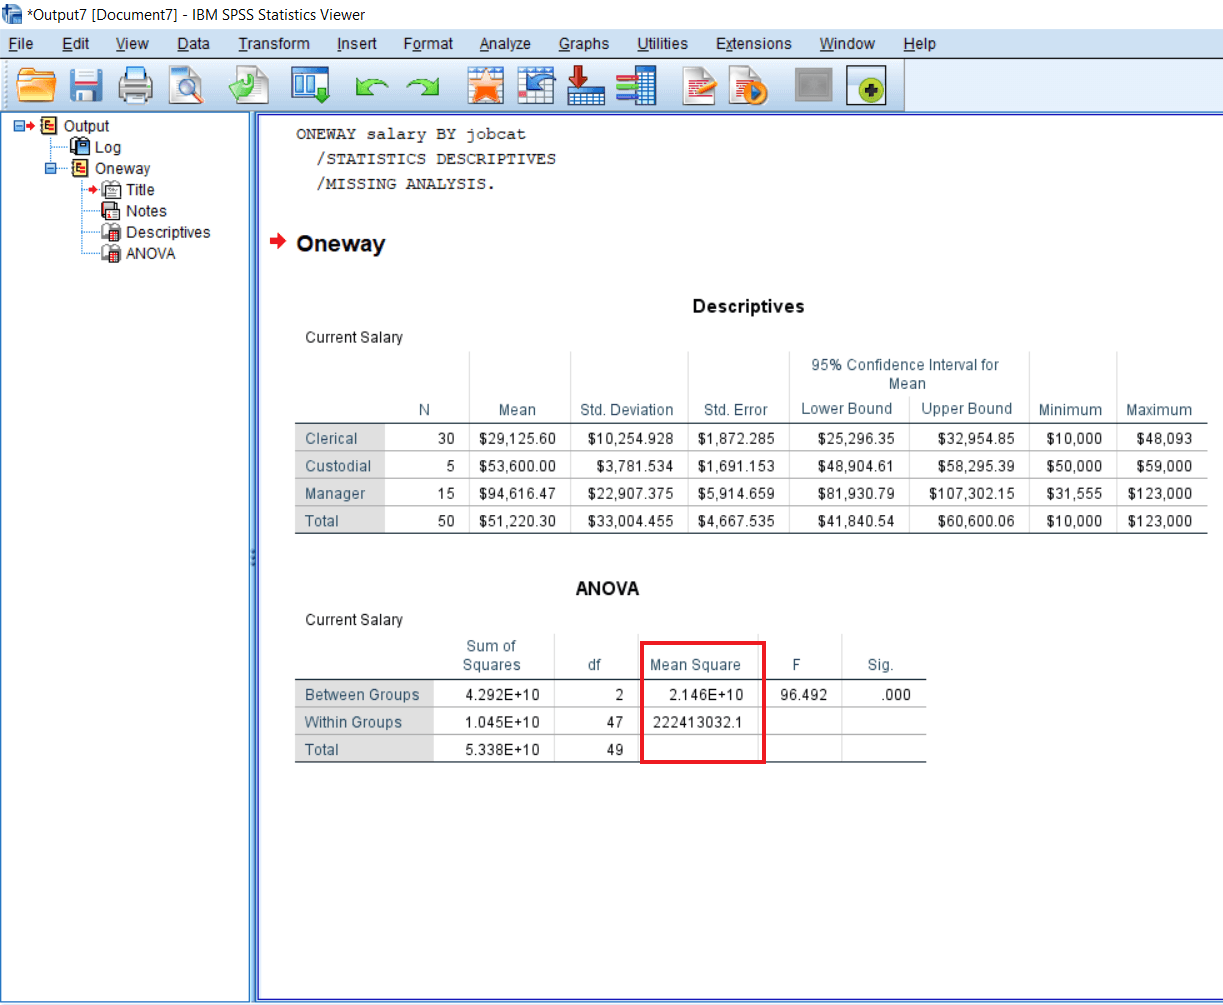
F value is a ratio between the Mean square for Between-group divided by the Mean square for Within-group. So if we divide 2.146E+10 by 222413032.1, we will get F's value, i.e., 96.492. 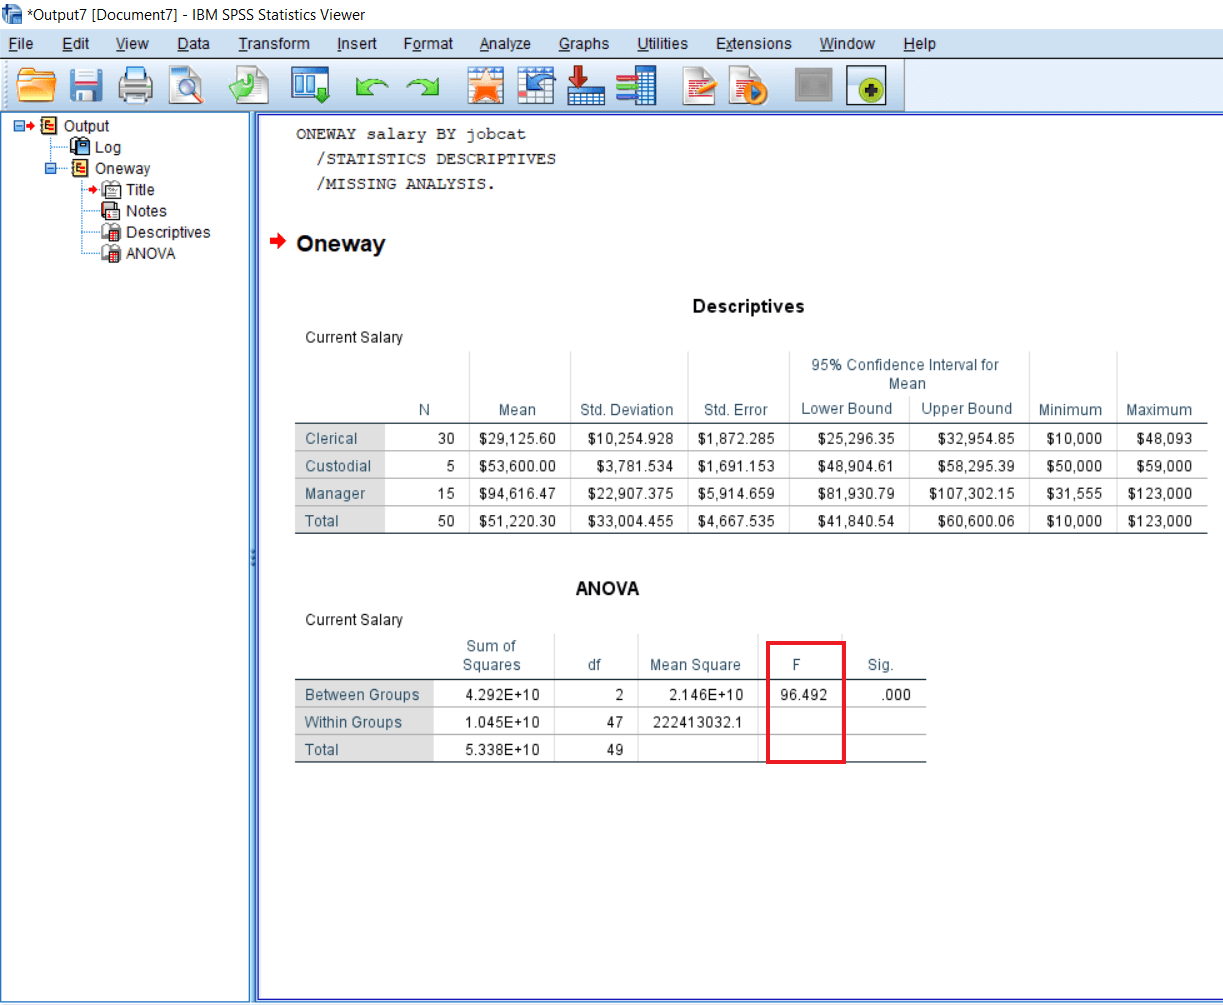
The Significant is very high because it is a .001 label. So we will say ANOVA is significant. It means there is a significant difference between the salaries of three job categories. Managers are drawing a significantly higher amount of salary as compare to Clerks and Custodial employees. But ANOVA tells us only the significant difference between groups. It does not tell us whether which group is drawing significantly higher salaries as compared to other groups. So we can make some conclusions by looking at these means score. The one group is drawing more salary as compared to others, but there is no information about the significances. 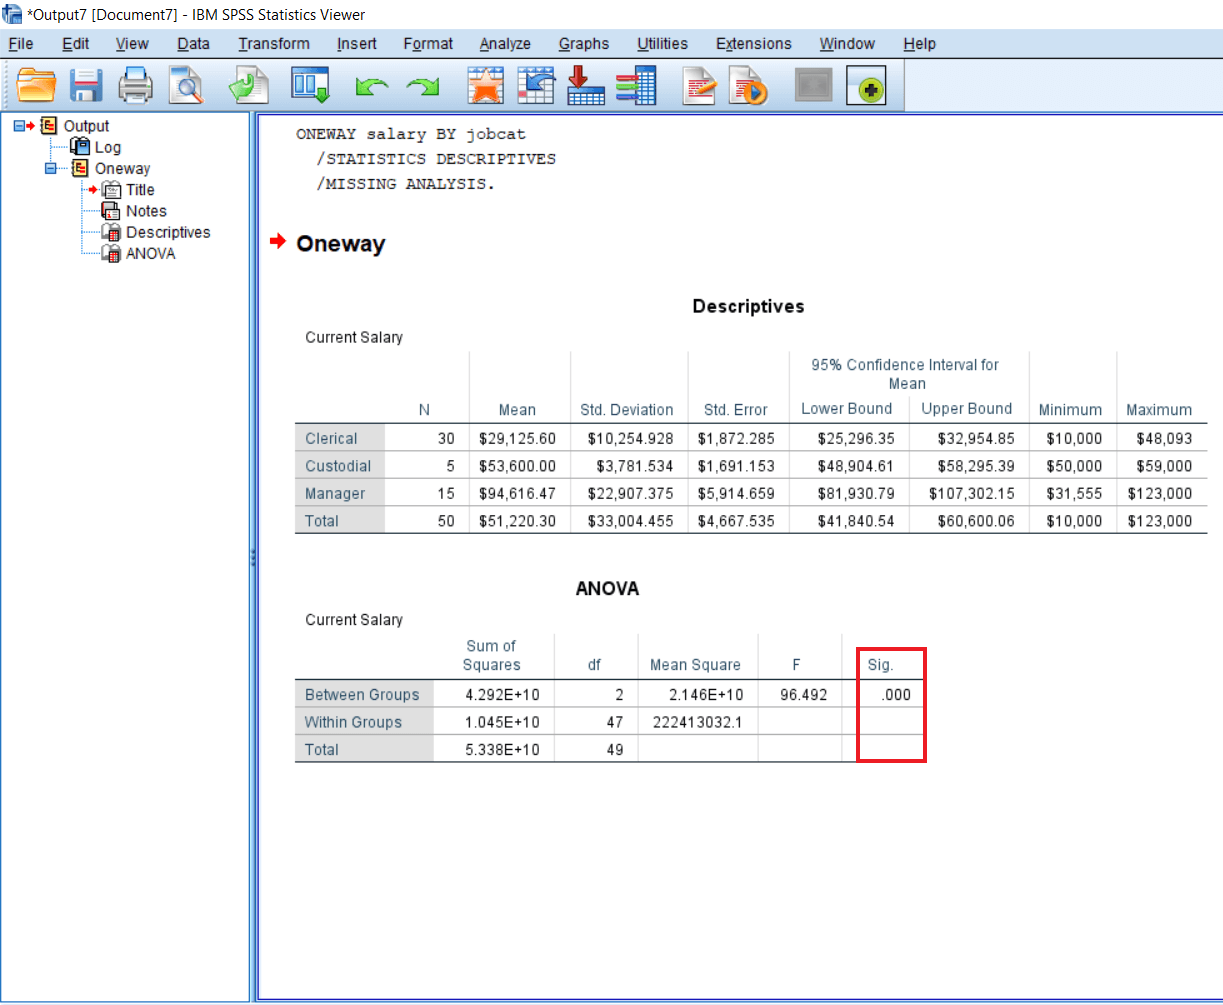
Next TopicRegression in SPSS
|
 For Videos Join Our Youtube Channel: Join Now
Feedback
- Send your Feedback to [email protected]
Help Others, Please Share


