| |

Creating Dataset of Perceptron ModelNow, we will get the knowledge of how to create, learn, and test a Perceptron model. The implementation of the Perceptron model in PyTorch is done through several steps such as creating the dataset for a model, set up the model, training of the model, and testing of the model. Let start with our first step, i.e., creating the dataset. For creating a dataset, we will import a dataset directly from SDK learn. SDK-learn provides us access to many pre-prepared datasets. We will get access to all these datasets by simply importing a dataset. In this, we also use numpy library for further manipulating and analyzing of this data, and at last most common library which is used for plotting out dataset, i.e., matplotlib.pyplot will be imported. In this we first use SDK learn to create a linearly separable dataset then using torch we create a perception based Neural Network. After that, Neural Network will train to learn how to fit our dataset such that it is able to separate our data into two discrete classes. This will be done using the optimization algorithm (Gradient Descent) from which you might be familiar. In this, we will be used make_blobs() method. This function will create a cluster of data points which are all randomly centered on a chosen central point for the cluster. Let see the steps of creating the dataset 1. The first step is to import all the required libraries, such as a torch, sklearn, numpy, and matplotlib.pyplot. 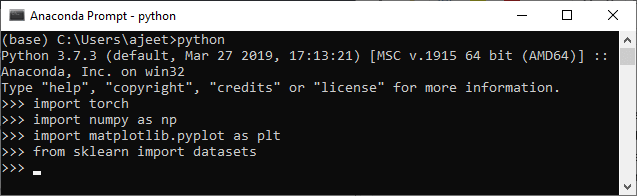
2. In the second step, we define no of data points, and then we create a dataset by using make_blobs() function. As I told you, This function will create a cluster of data points. 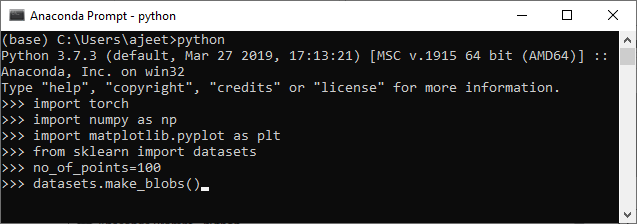
3. Before calling the make_blobs() function, we need to create a nested list which specifies the coordinates of the center of our cluster. So we have to call the list centers and define central coordinates for our cluster in the following way. 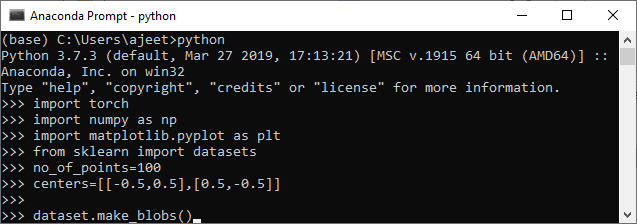
4. Now, we will create our dataset, and we will store our data points into the variable x while storing values into the variable y and we will make use of our label just a bit. 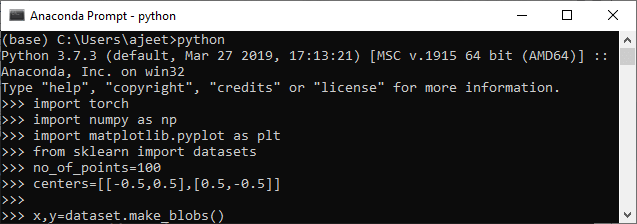
5. Our dataset is not created yet because we did not pass any appropriate arguments of this function. So we pass all arguments here. The first argument represents the no of sample points; the second argument is random state, the third argument is centers and last argument that will allow us to generate our very first linearly separable dataset, i.e., cluster std. 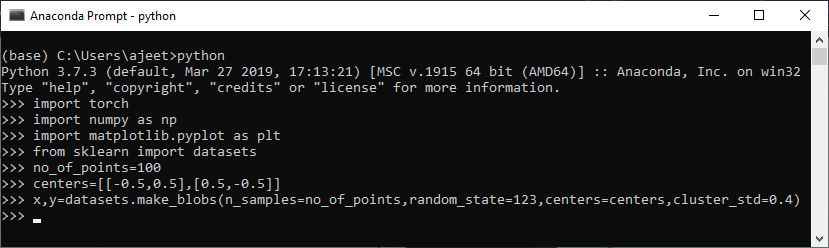
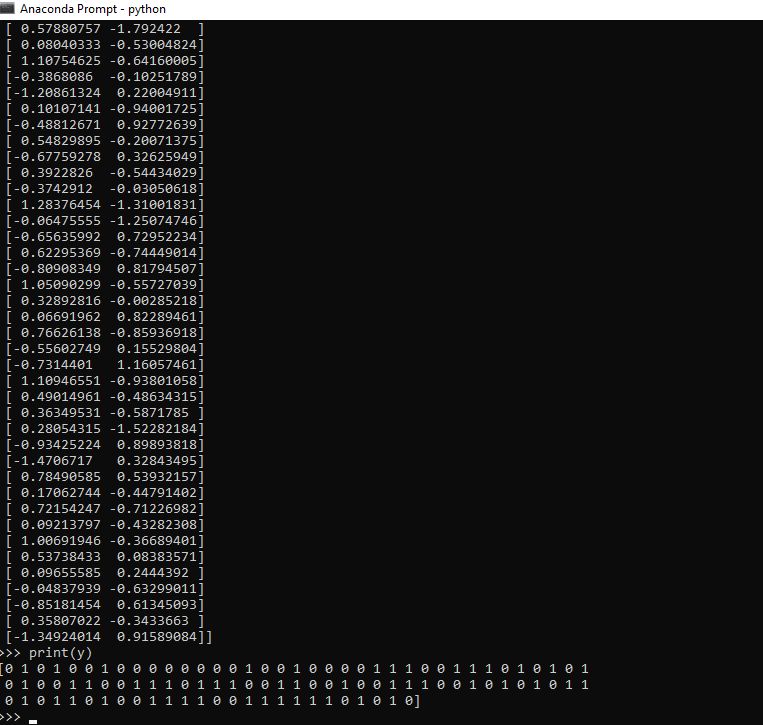
6. In the next step, we visualize our data by print x and y coordinates like as 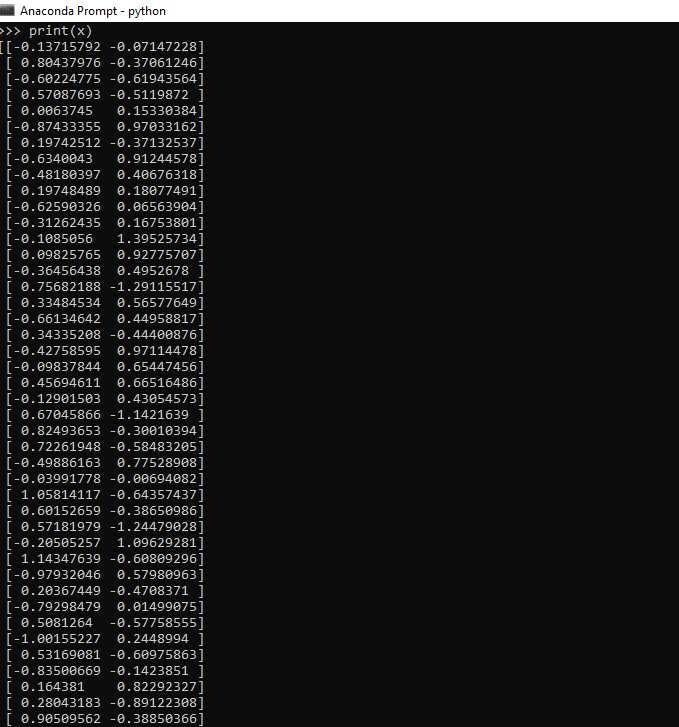
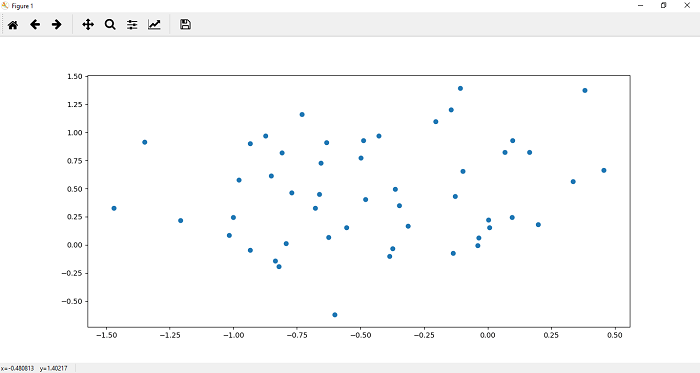
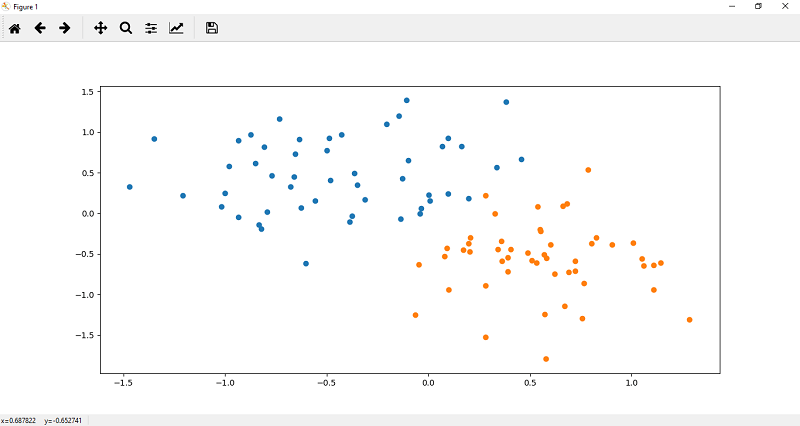
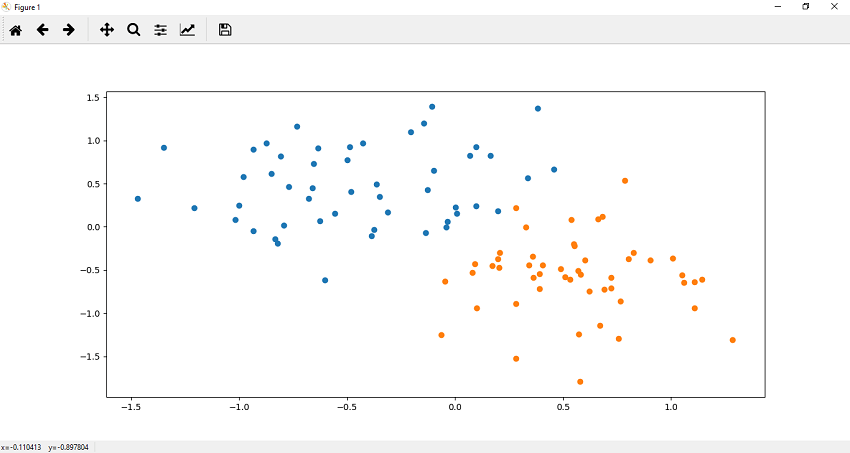
7. Now, after customizing our dataset as desired, we can plot and visualize it using plt.scatter() function. We define x and y coordinates of each label dataset. Let's begin with the dataset which label is 0. It plots the top region of our data. Scatter function for 0 labeled dataset is defined as 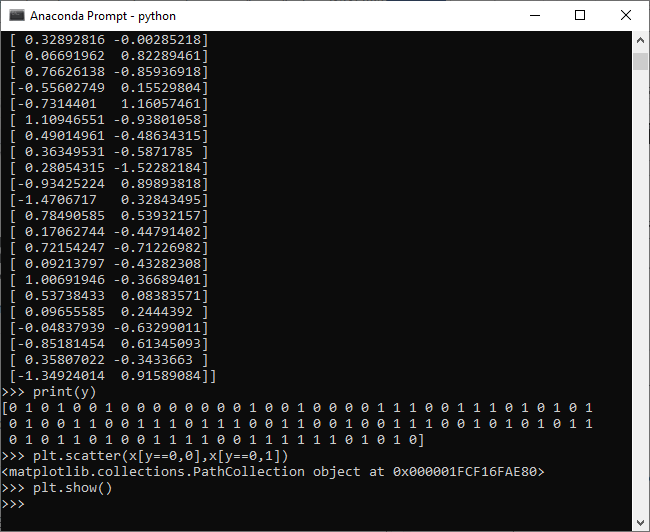
8. Now, we plot the points in the lower region of our data. The scatter function() for one labeled dataset is defined as 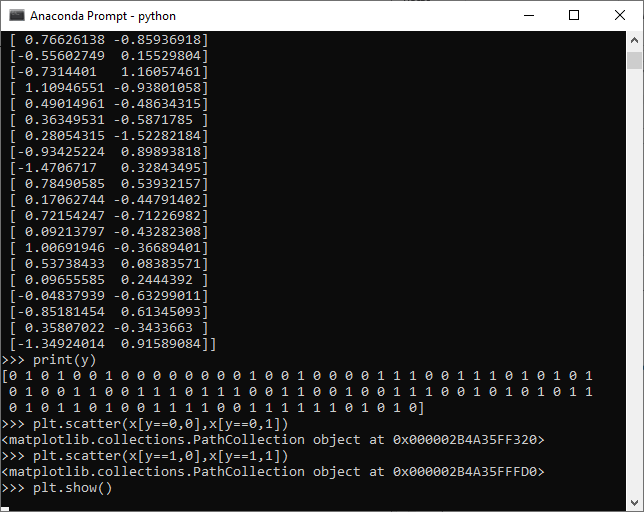
9. Keep in mind to train a model x, and y coordinates both should be numpy array. So what we do we will change our x and y values into tensor like as 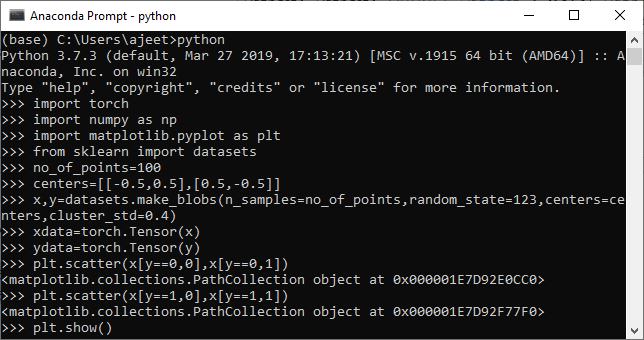
Next TopicPerceptron Model
|
 For Videos Join Our Youtube Channel: Join Now
Feedback
- Send your Feedback to [email protected]
Help Others, Please Share


