| |

Perceptron ModelIt is essential to know about the perceptron model and some key terms like cross-entropy, sigmoid gradient descent, and so on. So what is the perceptron model, and what does it do? Let see an example to understand the perceptron model. Imagine there is a hospital which annually does the operation of thousands of patients and tells you to create a predictive model which is able to accurately determine whether or not someone is likely to be cancer or not. With the help of previously determine data, we predict whether or not someone is likely to be cancer-based on their age, which traverses the x-axis and their quantity of tobacco inhaled which traverse the y-axis. 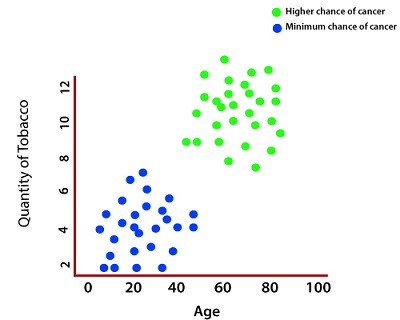
So that the person who has higher in the age and quantity of tobaccos which he takes have higher chances of cancer and if a person has minimum age and quantity of tobaccos which he takes, have a minimum chance of cancer. Every green point, which indicates a higher chance of cancer, was initially assigned a label of zero and every blue point, which indicates a lower chance of cancer, was initially assigned a label of one. 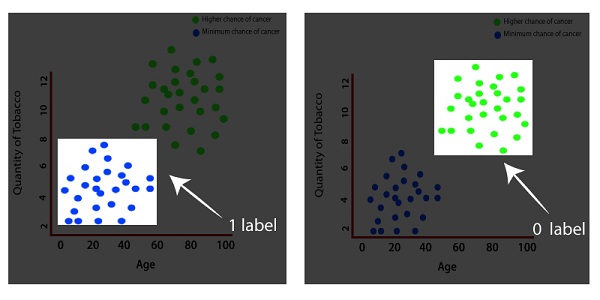
So, we will start with a random model that will not correctly classify our data, but then the model will be trained through some optimization algorithm. The model will be trained through many iterations until it reaches the parameter value, which can classify our data correctly. We use previously labeled data everything here is labeled one, and everything here is label zero. 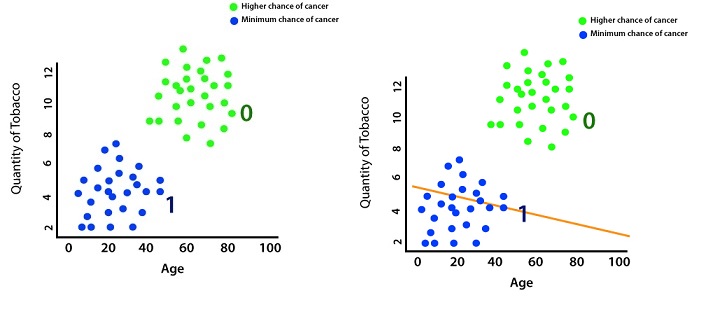
We use this labeled data to come up with a predictive model which classifies our data into two discrete categories. Using that model, we can now make a prediction on newly input data which don't have a label based on whether or not that point lies below the line or above it. We will train our model, which can determine that this person belongs in class one such that they are most likely healthy. 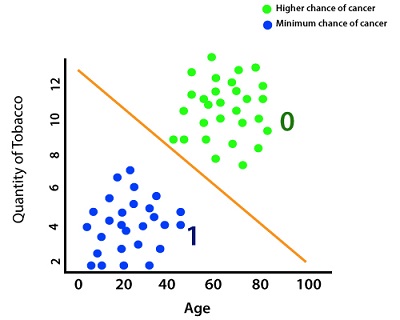
Now, the biggest question is how the computer know-how to come up with this linear model does. For this purpose, we will calculate the error associated with this model and then readjust the parameters of the model to minimize the error and properly classify the data points. We will use cross-entropy () function to find an error and sigmoid gradient descent to optimize the parameters. Let starts to implement the code in which we will see how cross-entropy function and sigmoid gradient descent is used. So, we work on the data set which we have created in the last section. Now, with the help of this data set, we will start implementing our code and create a basic perceptron model. At first we put plt.scatter(x[y==0,0],x[y==0,1]) and plt.scatter(x[y==1,0],x[y==1,1]) into a function for further use as To create a basic perceptron model we have to follow the following step: Step 1. Our first step is to create a linear model. For this, we have to create our model class as we have implemented in the linear regression model with the init() method and forward() method. The init() method is similar but forward() method quite differs from the linear regression model. We define forward () as before replacing self for the first argument, and after that, we need to pass the inputs x. After that we make prediction by passing our data x into our linear model. It's not sufficient, we have to convert the values into probabilities by applying sigmoid () method as follows: Our initialization is finished and now, we are ready to use it. Step 2 We will initialize a new linear model using Perceptron_model() constructor and pass input_size and output_size as an argument. Now, print the random weight and biased values which were assigned to it as follows: Before this, to ensure consistency in our random result, we can seed our random number generator with torch manual seed, and we can put a seed of two as follow Step 3 Our next step is to extract the model parameters by unpacking model. These parameters are extracted in the form of a list with two-element, i.e., A, B, and printing both values as follows: Here, A is weight, and B is biased. 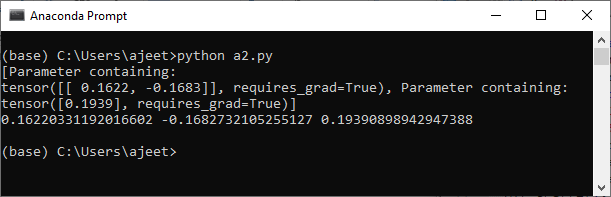
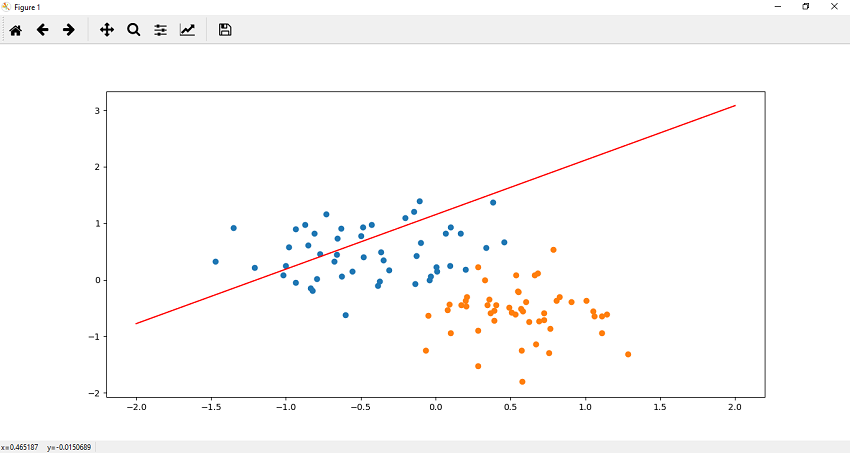
For cleanness we use function which returns the value A1.item(), A2.item() and B1[0].item() in the following way Step 4 Now, we plot our linear model with the parameter which we extract in the form of list. We use title, line equation and so on. We create a user define function to plot our data. Let see the code of plotting the linear model. 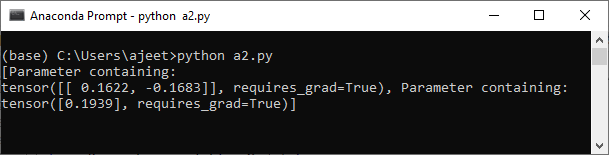
Next TopicTraining of Perceptron Model
|
 For Videos Join Our Youtube Channel: Join Now
Feedback
- Send your Feedback to [email protected]
Help Others, Please Share


