| |

Data Reshaping in RIn R, Data Reshaping is about changing how the data is organized into rows and columns. In R, data processing is done by taking the input as a data frame. It is much easier to extract data from the rows and columns of a data frame, but there is a problem when we need a data frame in a format which is different from the format in which we received it. R provides many functions to merge, split, and change the rows to columns and vice-versa in a data frame. 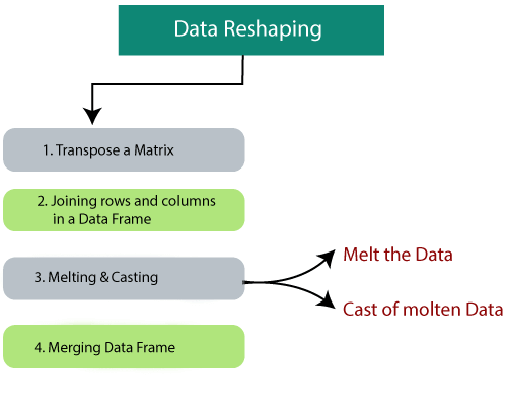
Transpose a MatrixR allows us to calculate the transpose of a matrix or a data frame by providing t() function. This t() function takes the matrix or data frame as an input and return the transpose of the input matrix or data frame. The syntax of t() function is as follows: Let's see an example to understand how this function is used Example Output: 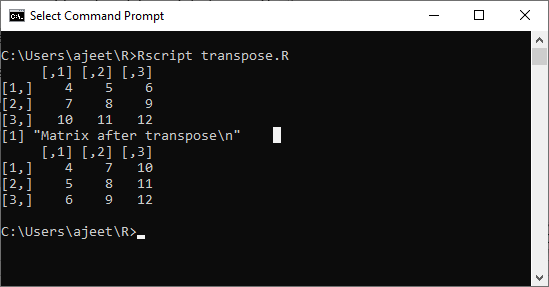
Joining rows and columns in Data FrameR allows us to join multiple vectors to create a data frame. For this purpose R provides cbind() function. R also provides rbind() function, which allows us to merge two data frame. In some situation, we need to merge data frames to access the information which depends on both the data frame. There is the following syntax of cbind() function and rbind() function. Let's see an example to understand how cbind() and rbind() function is used. Example Output: 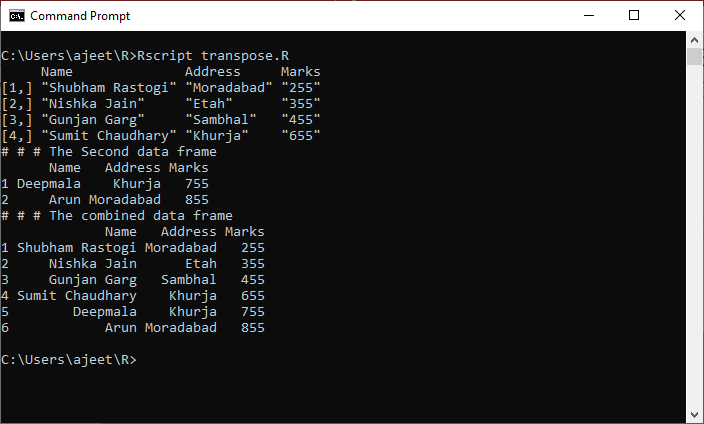
Merging Data FrameR provides the merge() function to merge two data frames. In the merging process, there is a constraint i.e.; data frames must have the same column names. Let's take an example in which we take the dataset about Diabetes in Pima Indian Women which is present in the "MASS" library. We will merge two datasets on the basis of the value of the blood pressure and body mass index. When selecting these two columns for merging, the records where values of these two variables match in both data sets are combined together to form a single data frame. Example Output: 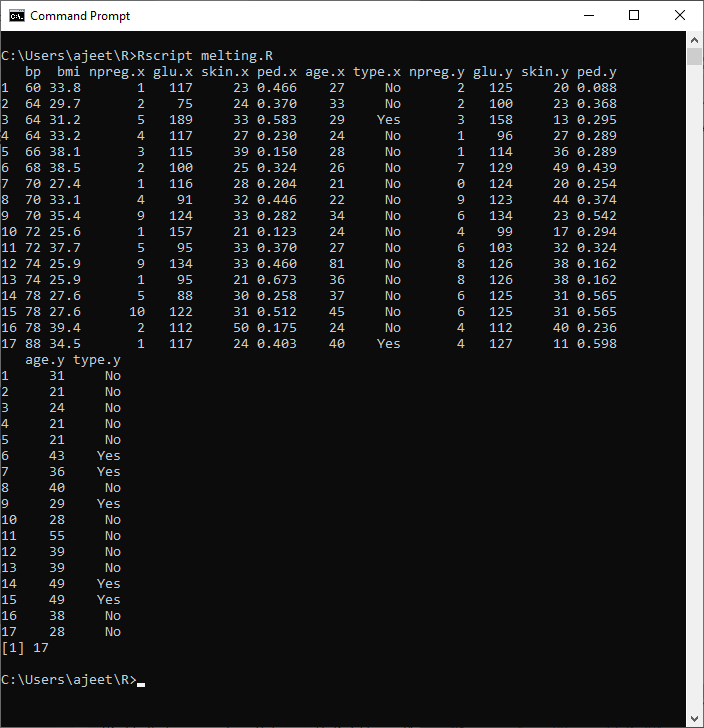
Melting and CastingIn R, the most important and interesting topic is about changing the shape of the data in multiple steps to get the desired shape. For this purpose, R provides melt() and cast() function. To understand its process, consider a dataset called ships which is present in the MASS library. Example Output: 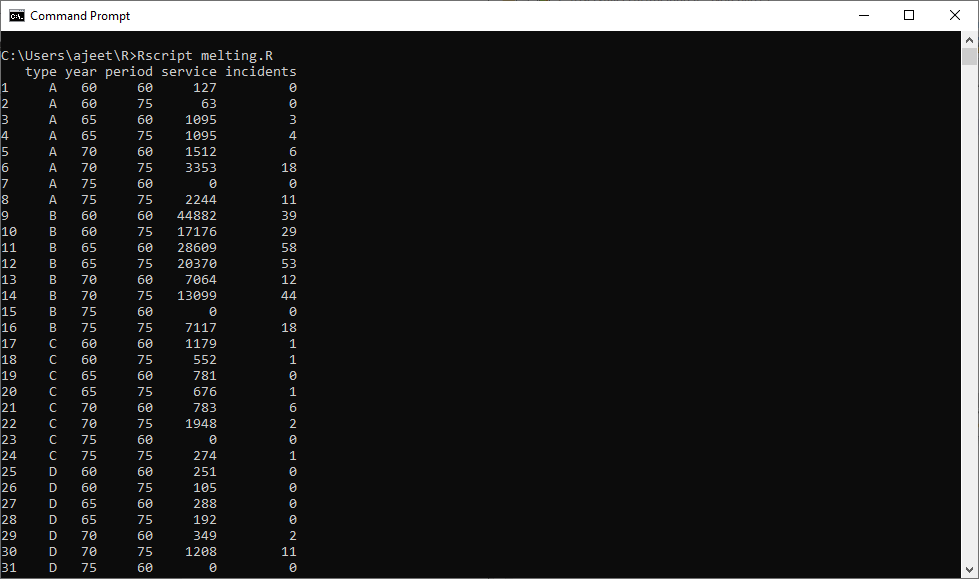
Melt the DataNow we will use the above data to organize it by melting it. Melting means the conversion of columns into multiple rows. We will convert all the columns except type and year of the above dataset into multiple rows. Example Output: 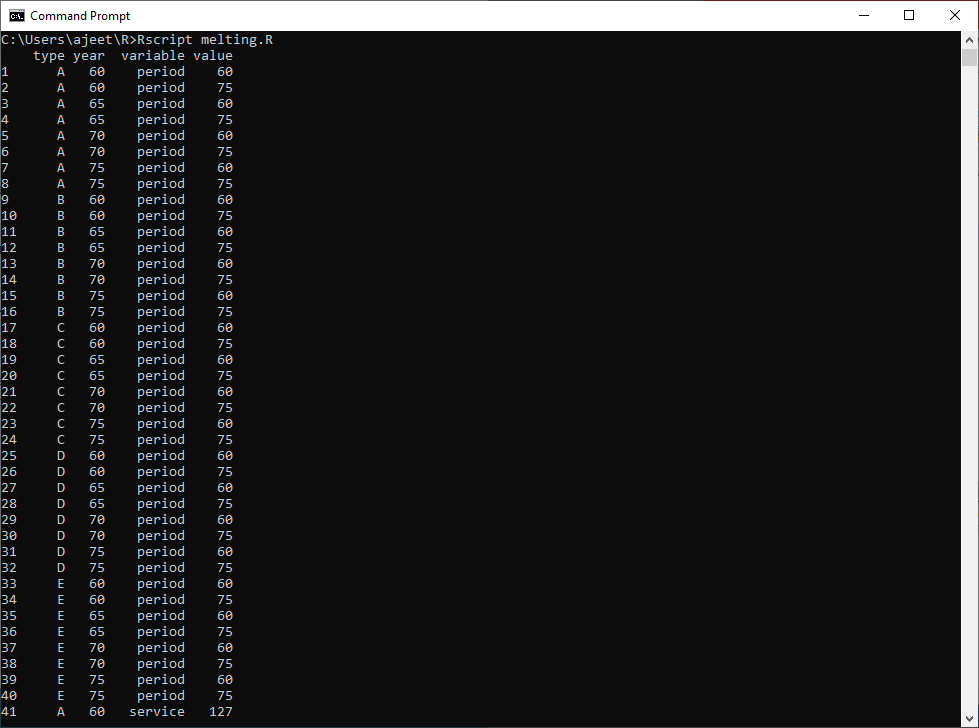
Casting of Molten DataAfter melting the data, we can cast it into a new form where the aggregate of each type of ship for each year is created. For this purpose, R provides cast() function. Let's starts doing the casting of our molten data. Example Output: 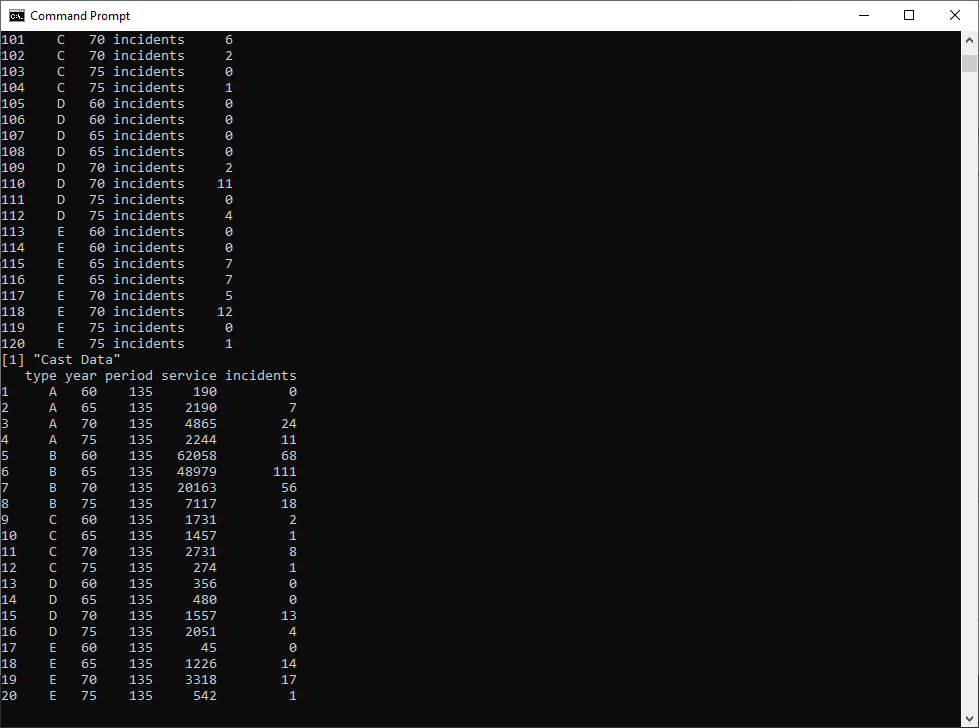
Next TopicR Object Oriented Programming
|
 For Videos Join Our Youtube Channel: Join Now
Feedback
- Send your Feedback to [email protected]
Help Others, Please Share


