| |

R Line GraphsA line graph is a pictorial representation of information which changes continuously over time. A line graph can also be referred to as a line chart. Within a line graph, there are points connecting the data to show the continuous change. The lines in a line graph can move up and down based on the data. We can use a line graph to compare different events, information, and situations. A line chart is used to connect a series of points by drawing line segments between them. Line charts are used in identifying the trends in data. For line graph construction, R provides plot() function, which has the following syntax: Here,
Let?s see a basic example to understand how plot() function is used to create the line graph: ExampleOutput: 
Line Chart Title, Color, and LabelsLike other graphs and charts, in line chart, we can add more features by adding more parameters. We can add the colors to the lines and points, add labels to the axis, and can give a title to the chart. Let?s see an example to understand how these parameters are used in plot() function to create an attractive line graph. ExampleOutput: 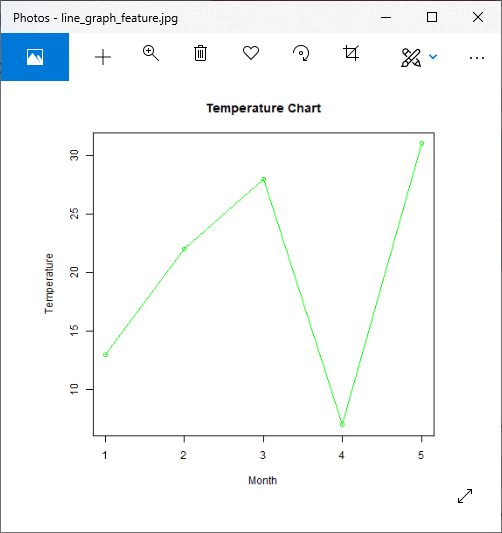
Line Charts Containing Multiple LinesIn our previous examples, we created line graphs containing only one line in each graph. R allows us to create a line graph containing multiple lines. R provides lines() function to create a line in the line graph. The lines() function takes an additional input vector for creating a line. Let?s see an example to understand how this function is used: ExampleOutput: 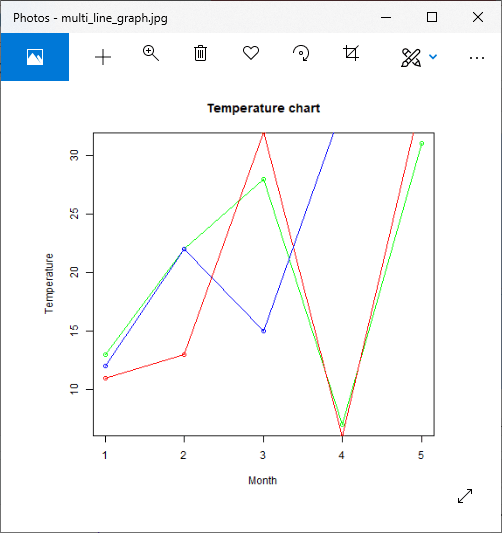
Line Graph using ggplot2In R, there is another way to create a line graph i.e. the use of ggplot2 packages. The ggplot2 package provides geom_line(), geom_step() and geom_path() function to create line graph. To use these functions, we first have to install the ggplot2 package and then we load it into the current working library. Let?s see an example to understand how ggplot2 is used to create a line graph. In the below example, we will use the predefined ToothGrowth dataset, which describes the effect of vitamin C on tooth growth in Guinea pigs. ExampleOutput: 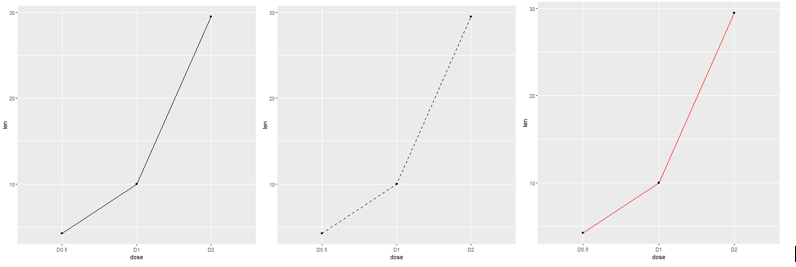
Next TopicR Scatterplots
|
 For Videos Join Our Youtube Channel: Join Now
Feedback
- Send your Feedback to [email protected]
Help Others, Please Share


