| |

Redux DevToolsOverviewWe might have come across the fact that working with Redux seems quite intimidating because of fancy terminologies like a store, actions, reducers, middleware, etc. But, here's a catch. Have we seen this happening? That's the reason where Redux Devtools kick in. By using it in the form of extension, we can visualize all of these complex concepts and events that happen in a Redux application under the hood. In this tutorial, we'd be looking at such a simple yet mystified task of setting up a store to gaining some knowledge about middleware using Redux DevTools with various examples. This tutorial assumes that we have a basic understanding of setting up middleware, stores, and actions in Redux. So, let's proceed. Redux DevTools is a development time package that provides power-ups for our Redux development workflow. The main focus is to keep in mind the code stripping while walking through production. To use Redux DevTools, we need first to choose a React component that will provide an excellent UI to carry out the development process at ease. The blend of UI is highly centric because different applications use different UIs. Thus Redux DevTools is building in this regard to keep this idea flexible, so developers needn't panic about this aspect. Another essential aspect to keep in mind is to have a "monitor" based on React component. We would highly recommend using LogMonitor to inspect state and time and then wrap it up into a DockMonitor to move it across the screen quickly. This makes the development through Redux even simpler and thus the name DevTool. What is the Redux DevTool extension?DevTool is a Chrome-based extension that provides a console where we can set up our development environment with Redux. This extension helps in visualizing the actions and state changes that generally occur in a Redux-based application. We will try to understand this by setting up its extension for a sample application. It is quite easy to set up this extension using Google Chrome. See the below steps to add this extension to the browser. Environment Setup MethodsWorkflowTo understand the workflow and how things are going to work, we will set up the Redux DevTools step by step for a simple project. The steps involve:
Adding ExtensionDownload and install Redux DevTools from the browser. Add the extension to the browser as shown below. 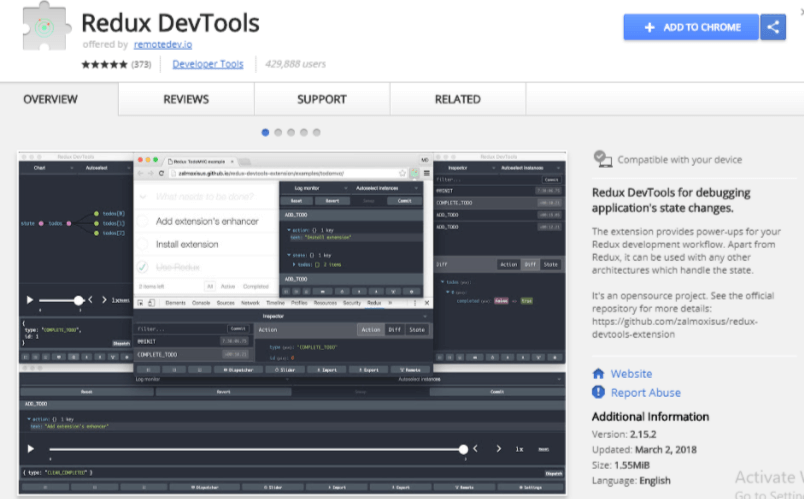
After the extension is added, we can see the icon on the top right corner of the browser as shown. 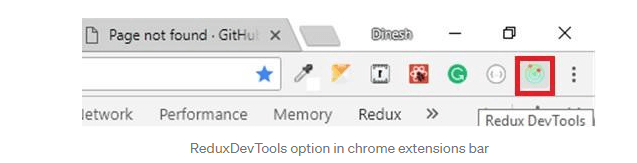
Installing DevTools dependenciesTo install the dependencies of Redux DevTools, all we need to do is to seek some commands into our system. The development dependencies can be served with the below commands. After this step, we should be importing the compose functionality from Redux DevTools using The next step is to create a store from using this compose method as shown below The main objective of installing these dependencies is to probe inside our store and view the states and actions. It can be called more of a diagnostics tool where we see what's happening. Another way of creating a store is given in the code snippet which signifies a store with the Redux DevTools extension. After this step, let's install middleware because middleware in Redux makes it possible to use asynchronous network calls and keep the update accordingly. In the following example, we will see how a store in middleware looks and how to set up DevTools for the same. Thus, in the example below, we would be using Redux-promise middleware. The code snippet and command for the following are. The command installs all the promise based middleware to the Redux. Redux DevTools Console Break-downNow that we have set up everything from store to dependencies, let's understand the main stuff. Since we already have installed the browser extension for Redux DevTools correctly, we would be discovering the console and discuss their features. Considering that everything is installed properly when we click on this new option, we might see something like this. 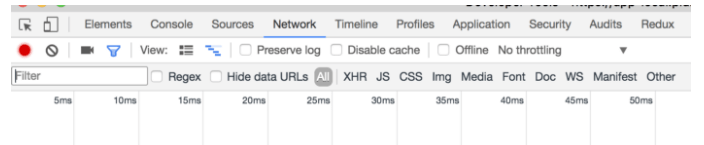
Let's try to breakdown some of the options shown in the above console. Left side console tools The left-hand column of the dash shows the real-time actions that are being fired on the current page since they are already defined by the action creator types. 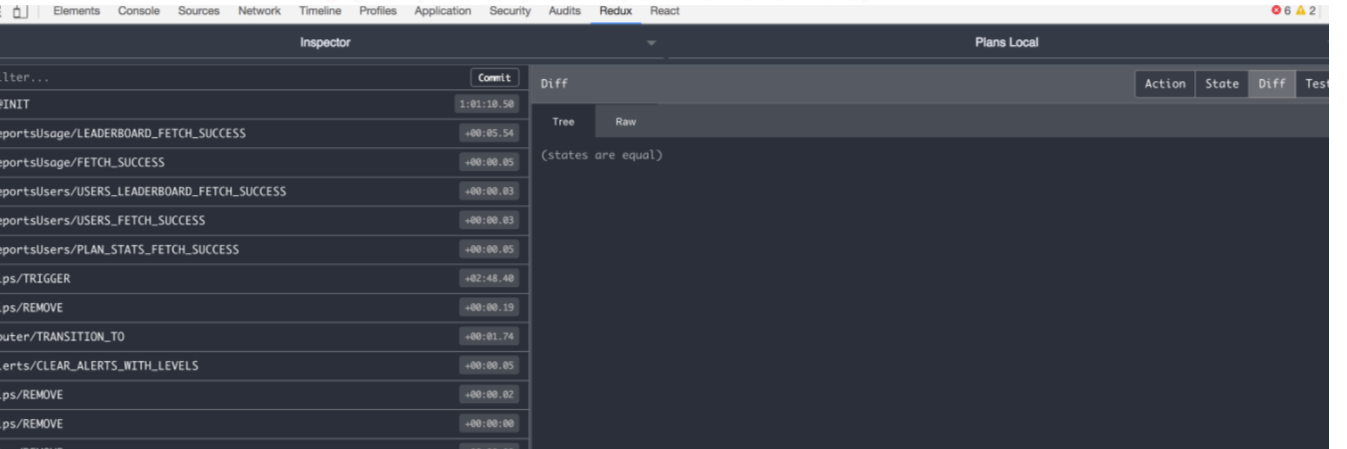
This comes complete with a filter option at the top and each time the action is fired after the previous one, the individual option pops up and displays two options Jump and Skip. This is where we can see time traveling and changing the application view. The Jump option takes our application to a state when the action is fired and the Skip option crosses out that action to show us how the application will look like without that action. These options tend to manipulate the application's real-time working environment and let us see how the actions are going to behave pre and post once the action is fired. Right side console tools The right side of the DevTools consists of the four most helpful options for the tool. The options are shown as follows. Diff It enables us to see the state of the application and the relation it is serving with for each action in the state. 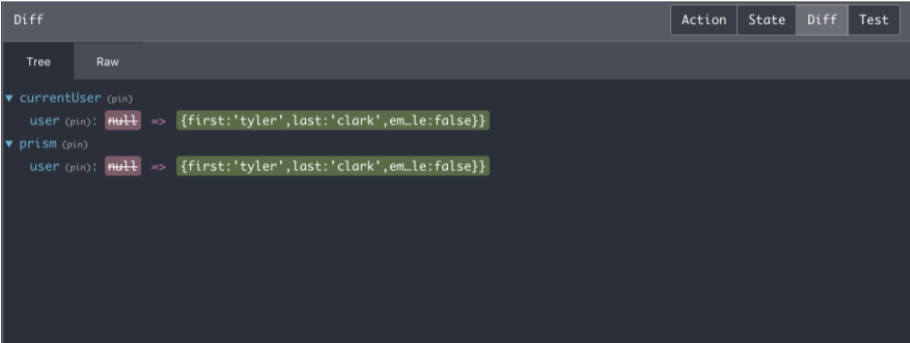
Whenever we select an action from the left-hand side of the console, the Diff option will show us only what the individual action changed in the state tree. Action The Action tab shows the individual action type and any that is being carried by the reducers when we click on it. 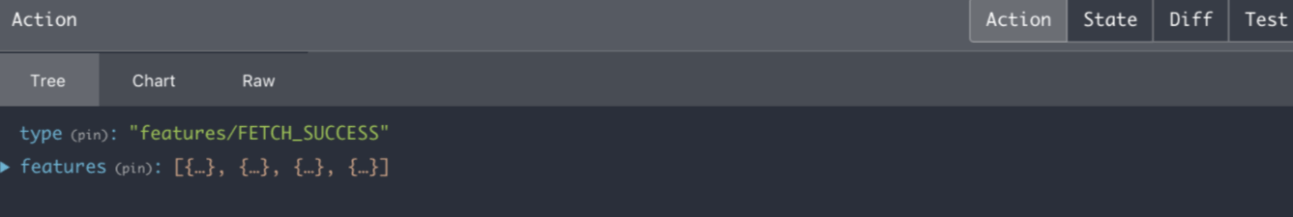
Considering the example in the above image, the action has a typical feature/FETCH_SUCCESS and it also carries data and the requested features to the reducer. We might have noticed that there are three sub-tabs Tree, Char, and Raw within the master action tab. They are used just to display the same data in different formats. To be precise, the Tree view is the default view and it summarizes the data into a single line, while the Chart tab shows the store tree up-t0-date and the Raw option shows all the included reducers combined to the corresponding data branches. The raw tab also shows the action creator in a code view. It appears something like this. 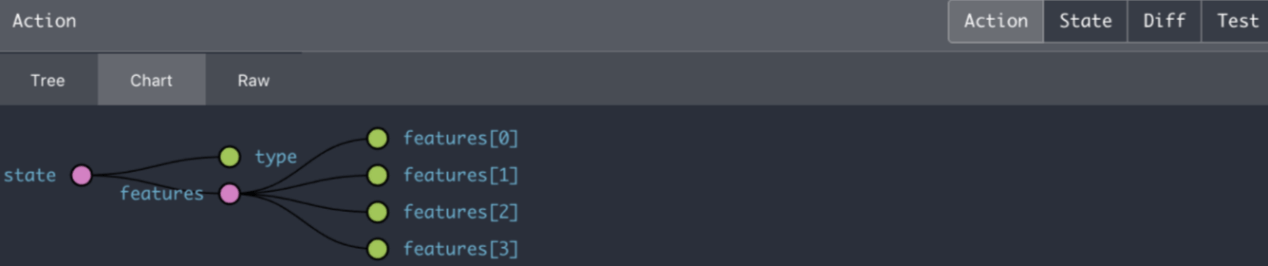
State This tab shows the entire state tree at the time of action selection at the left-hand side of the console. Test This tab is used to create test format in some previous pre-provided testing frameworks. It also takes into account the root state and provides the written test on what the end state should hold. 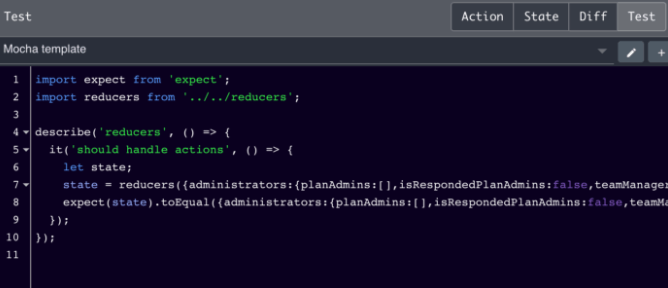
Top Console 
The top console offers two more tabs. The right tabs allow us to change between two instances of currently running applications on the page if we have different stores running on the same page. The left tab shows two different modes i.e. inspector mode, which is mainly treated as default nodes and is used to find the different tools used in the application. The other option is Log Monitor that shows whole actions and states along with a slider option to view in and watch the tree grow or shrink. The Chart shows the show the state in the form of a tree structure. Bottom Console 
The bottom of the console adds some additional functionality to carry out operations on the actions and states. It also allows time travel, looking into dispatched actions, importing and exporting states, and controlling them remotely.
Starting from the left, the first three options are mainly used to create a new console or view to the left, right, or bottom. Next comes the Pause option used to stop the recordings of actions being created within the console. SummaryIn this article, we learned from the very basics what Redux DevTools ranging from how it is installed and how the advanced options inside the console let us build the actions and state and visualize them. Redux DevTools not only offers control over the dispatch and action or state management options but lets us visualize them so that they can be easily managed. Later, we learned how to set up the store and adjust the system with the middleware. It is a bit complex procedure to keep logs of the actions and states. But with Redux DevTools it becomes easy to have control and manipulate them. Another fact that we learned in this article is about the console features that are offered to take the control to next level. In short, we can say that Redux alone is empty to operate but DevTools enhance its overall usage and performance.
Next TopicRaid 0
|
 For Videos Join Our Youtube Channel: Join Now
Feedback
- Send your Feedback to [email protected]
Help Others, Please Share


