| |

What is Standard Deviation?In general mathematics, a Standard Deviation is a number calculated by the specific formula. It is used to tell how mathematical values of a set vary from the mean or average of the same set. A low value of the Standard Deviation indicates that the numbers are very close to the average. A high value of standard deviation indicates that the numbers are far from the average. What is SAS-Standard Deviation?In SAS, Standard Deviation is a fundamental statistical procedure which measures how data varies in a data set. 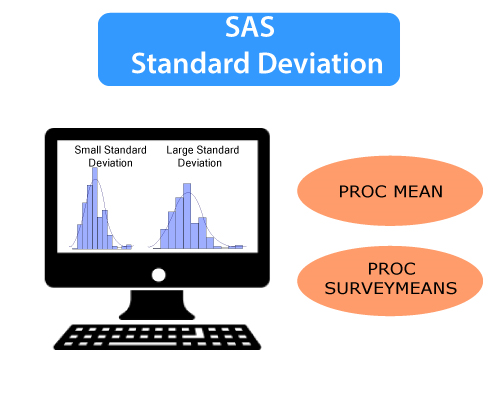
Mathematically, it measures each value of data set by calculating how far or near it is to the mean or average value of a data set.
Now we are going to learn types of the procedure by which we can apply Standard Deviation into our data. Besides, we will also see different ways of measuring the SAS standard deviation. In SAS, the Standard Deviation values are measured by using two methods, which are given below:
PROC MEANSWe can measure the standard deviation by using PROC means, but for this, we also need to choose the STD (standard deviation) statement in the PROC step. STD statement brings out all the standard deviation values from the data set for each numeric variable. Syntax: Where,
Example: In the following example, we are going to create the data set CARS1 from already available data sets CARS in the SAS help library, and will choose the STD statement in the PROC means step. Execute the above code in the SAS Studio: 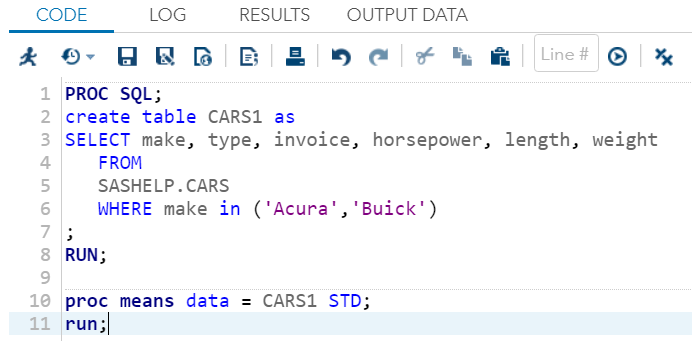
Output: 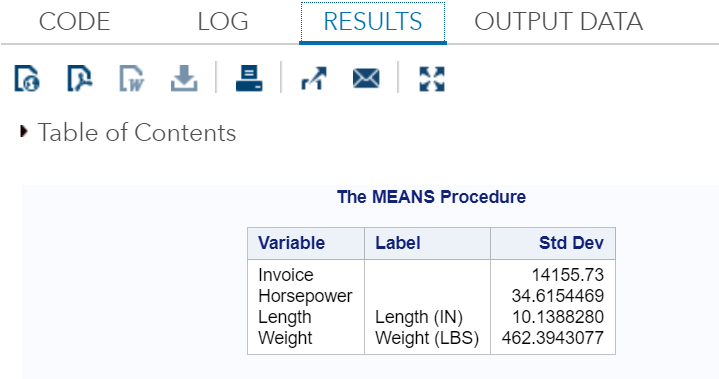
As we can see in the above output, all Standard Deviation values of Acura and Buick have been displayed in the table. These values are used in advanced data analysis. PROC SURVEYMEANSThis procedure is also used to calculate Standard Deviation along with some advanced features like measuring Standard Deviation for categorical variables. It also provides estimated values for the variance of the data set. Where,
Now, let's take a look at advanced features of PROC SURVEYMEANS: Procedure PROC SURVEYMEANS uses two statements to provide advanced features:
Class StatementThe Class statement creates statistics for each value in the class variable. Example: The following code describes the use of the class statement. Execute the above code in the SAS Studio: 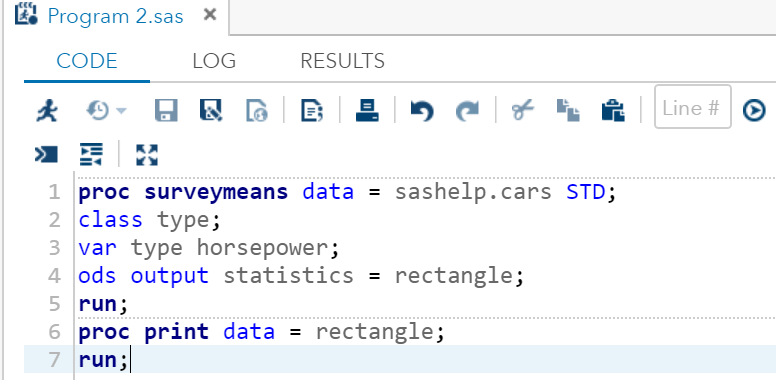
Output: 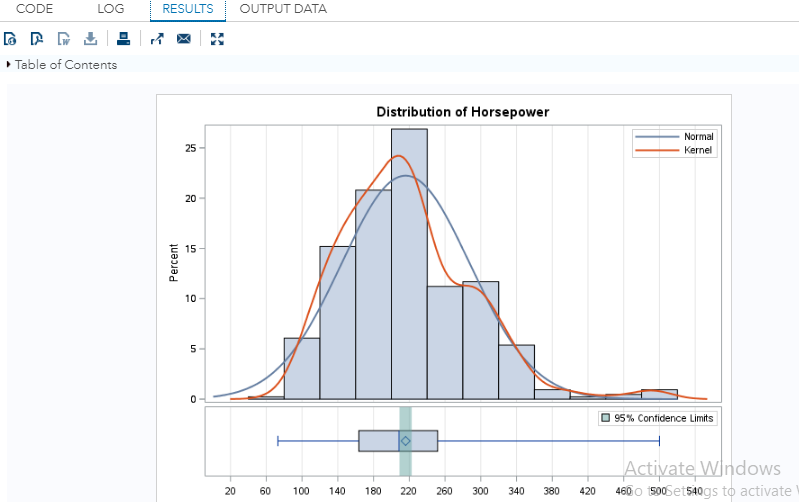
By StatementBy statement is used to create a group on the basis of the variable declared under By statement. Example: The following code describes the use of By statement: When we execute the above code in SAS Studio, it will produce the following output: Result for make = "Audi" 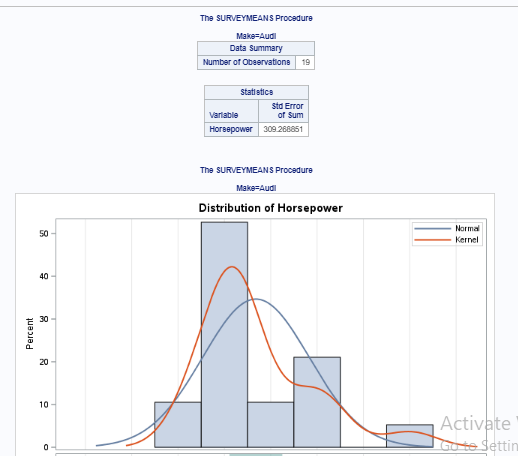
Result for make = "BMW" 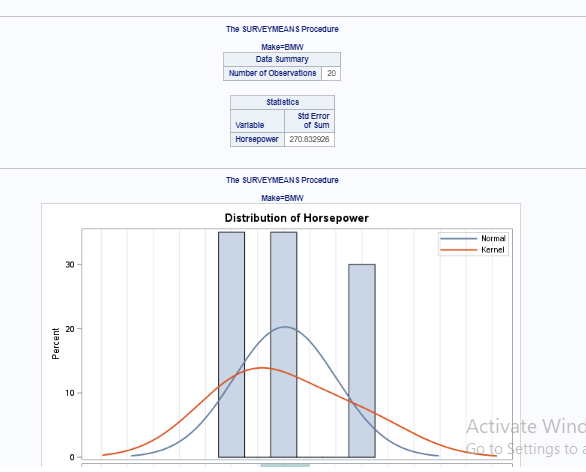
Result for make = "Acura" 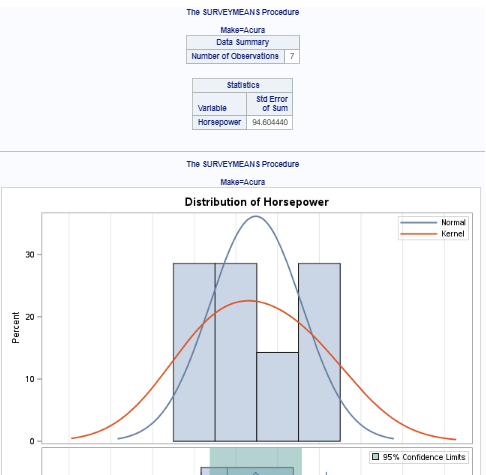
Next TopicArithmetic Mean
|
 For Videos Join Our Youtube Channel: Join Now
Feedback
- Send your Feedback to [email protected]
Help Others, Please Share


