| |

SciPy InterpolationInterpolation is defined as finding a value between two points on a line or a curve. The first part of the word is "inter" as meaning "enter", which indicates us to look inside the data. In the other words, "The estimation of intermediate value between the precise data points is called as interpolation". Interpolation is very useful in statistics, science, and business or when there is a need to predict the value that exists within two existing data points. Let's have a look how the interpolation work using the scipy.interpolation package. It will give following output in the form of an array. The np.linspace() function returns the interval between the given number. Output: [0. 0.55555556 1.11111111 1.66666667 2.22222222 2.77777778 3.33333333 3.88888889 4.44444444 5.] [-0.65364362 -0.57246439 -0.29634775 0.21191783 0.80382736 0.95857746 0.14971294 -0.92731369 -0.39972072 0.97296947] We can plot those arrays as two dimension of the points in space, let's consider the following example: Output: 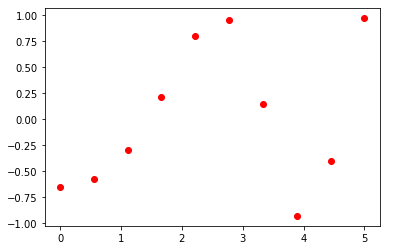
1-D InterpolationBy using the above data, creating an interpolate function and draw a new interpolated graph. Output: 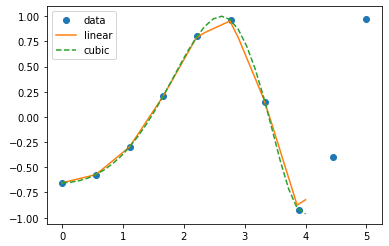
In the above program, we have created two function fun1 and fun2. The variable x contains the sample points, and variable y contains the corresponding values. The third variable kind represents the types of interpolation techniques. There are various methods of interpolation. These methods are the following:
SplinesThe spline is a flexible strip used to generate a smooth curve through a designated set of points. Spline interpolation requires two essential steps. In the first step, a spline representation of the curve is computed, and in the second step, the spline is evaluated at the desired points. 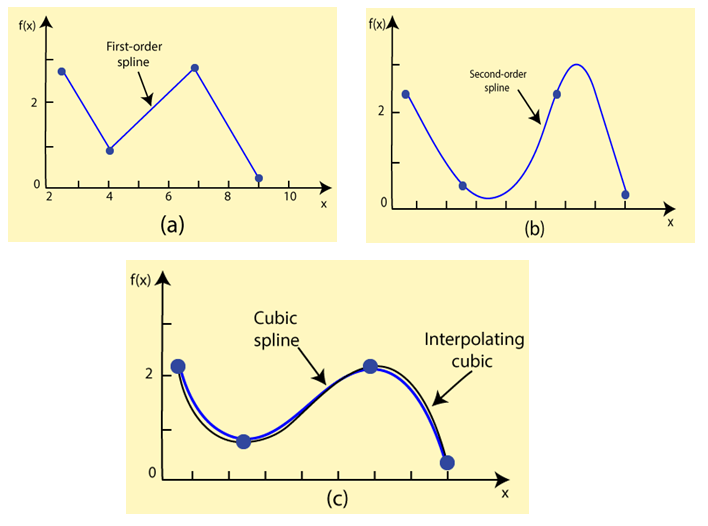
There are two methods to represent the curve. First, the direct spline method is used to find the spline representation of a curve in a two- dimensional plane using the function splrep(). The default spline order is cubic, but it can be changed with the input keyword, k. The splprep() allows us to define the curve parametrically in N-dimension space. The keyword argument is used to specify the amount of smoothing to perform during the spline fit. The standard output is a 3-tuple, (t,c,k), where, t represents the knot-point, c represents coefficient and k represents the order of the spline. Univariate SplineThe scipy.interpolate provides UnivariateSpline class, a suitable method to create a function, based on fixed data points. The syntax is as following: Parameters- w- It specifies the weight for spline fitting. It must be positive. s- It specifies the number of knots(points) by specifying a smoothing condition. k- It denotes the degree of the smoothing spline. Must be k<= 5. By default, k = 3, a cubic spline.
Let's consider the following example: Output: 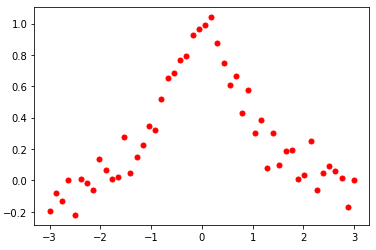
Next TopicSciPy Input and Output
|
 For Videos Join Our Youtube Channel: Join Now
Feedback
- Send your Feedback to [email protected]
Help Others, Please Share


