| |

SciPy SpectrogramThe signal processing toolbox consists of few filtering functions, a limited set of filter design tools. It also contains few B-spline interpolation algorithm for one-and two-dimensional data. The scipy.signal.spectrogram computes a spectrogram with the consecutive Fourier transforms. Spectrograms can be used as a way of reflecting the change of frequency content of non-signal signals over time. Output: 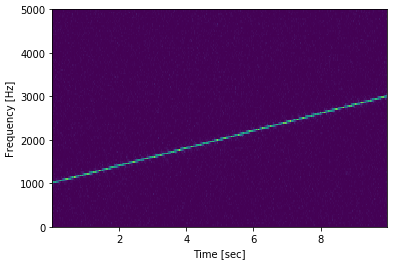
The scipy.signal.spectogram() returns the following array: f: ndarray Array of sample frequencies. t: ndarray Array of segment times. Sxx: ndarry Spectogram of x. By default the last axis of Sxx corresponds to the segment times
Next Topic#
|
 For Videos Join Our Youtube Channel: Join Now
Feedback
- Send your Feedback to [email protected]
Help Others, Please Share


Like/Subscribe us for latest updates or newsletter 


