Splunk InterfaceSplunk interface is the default window that interacts with the user. When we open the Splunk, we see the default dashboard of the Splunk, as shown in the following image 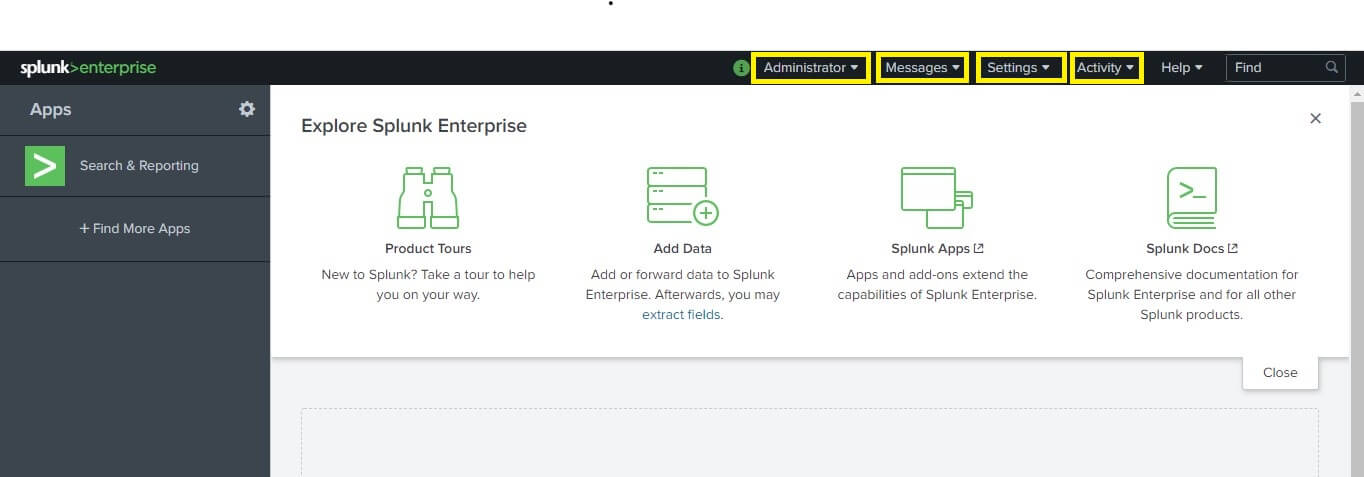
It contains the options like Administrator, Messages, Settings, Activity, Help, etc. at the top of the window. It contains all the tools that are needed by user for the processing of the data. We will discuss all the options in detail. Administrator OptionIt is the first drop-down option presented at Upper rightmost side of the interface It contains three sub-options:
In this option, you can change the Administrator email-id and password that you have created during the installation of Splunk. If you want to edit the administrator e-mail id and password, click on the Account Setting option. To change the credentials, you need to provide the old password and then type the new password. To save the changes, click on the Save button. 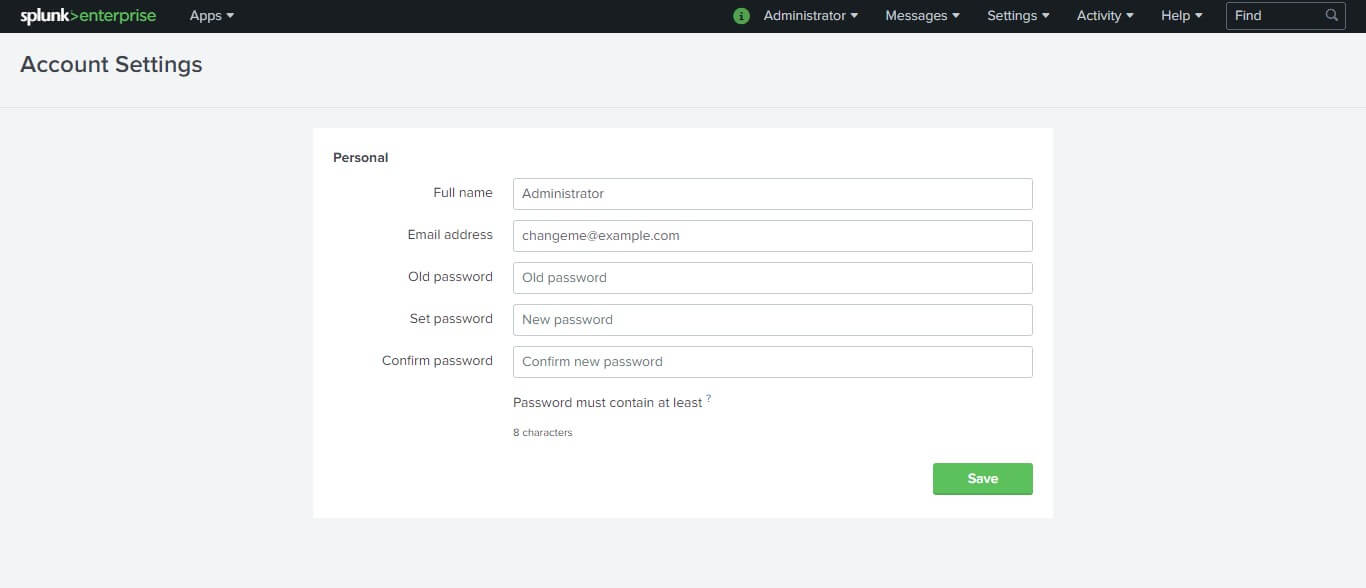
The preferences option allows us to change the time zone and default application option. It means that you can set the default page. It will display when you will open the application. When you have done all the changes then click on the Apply button, as shown in the following image. These options are in the Global Setting option. Adjacent to it, we also have a choice of SPL editor. We will talk about this option further in the tutorial. 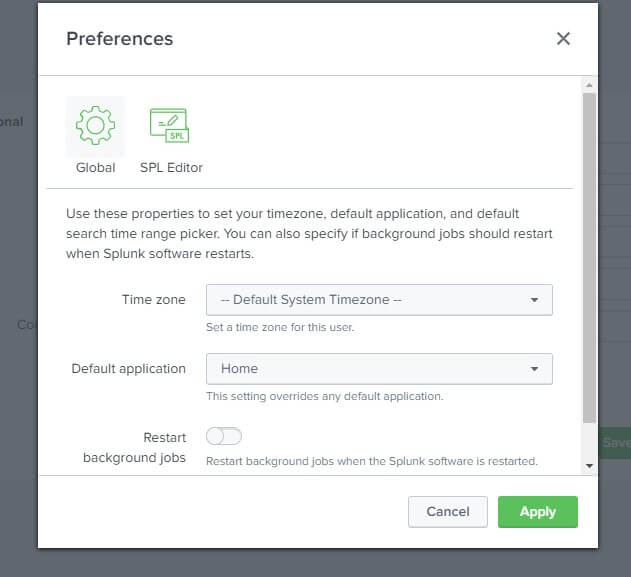
Message MenuMessage menu shows all the messages that are sent either by the Splunk community or by any other user or by the administrator. In the starting, you will not have any messages, but may be later you can get some. Setting MenuIn this menu, we can find all the essential features of Splunk. Including the Add, data-which is used to add the data in our tool to work on and monitoring console - which is used to monitor the data that we have added and perform an operation on it. We have many features in this menu, and we will discuss it all as per the need of a topic in the upcoming chapters. This is the menu that we are mostly going to interact with our tool. 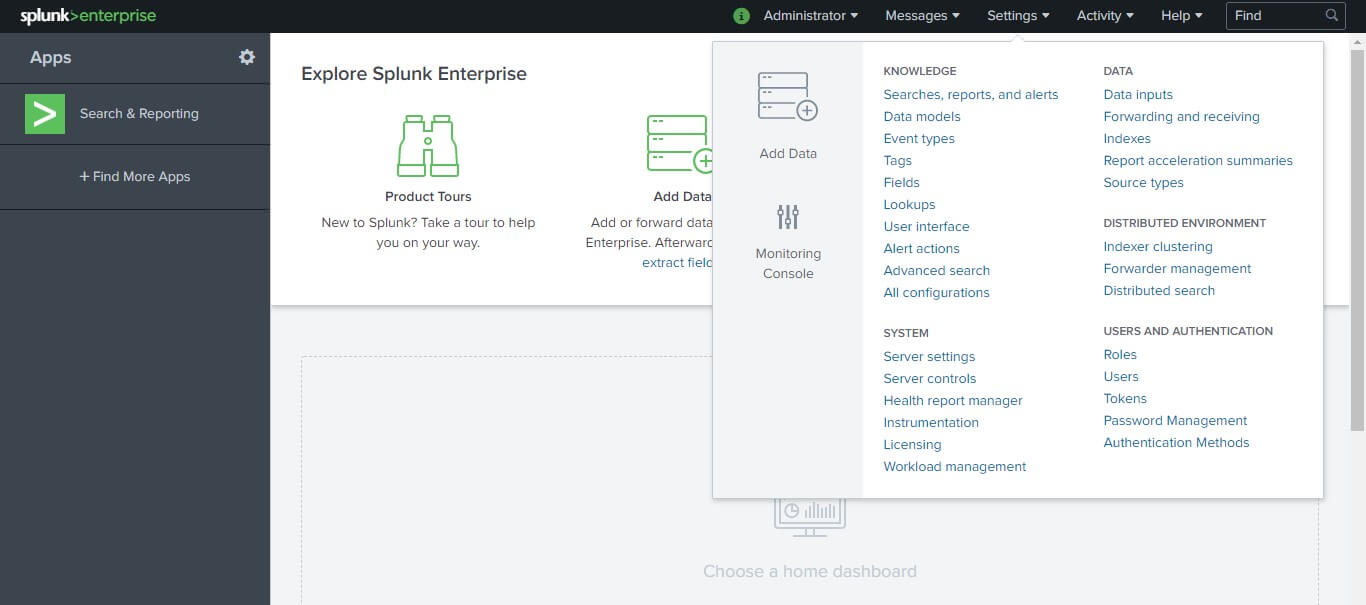
Search and ReportingOn the left-most side of our dashboard, we will find an option by the name search and reporting. This option takes us to the place where we can find all the data sets that are present in our tool. This option is used to look, manage, or visualize the existing dataset. Here, we have many options like:
We will be discussing all these options in detail in the next section. For now, it is necessary to know which option leads us to where in our tool. For the reference, you can have a look at the image provided. 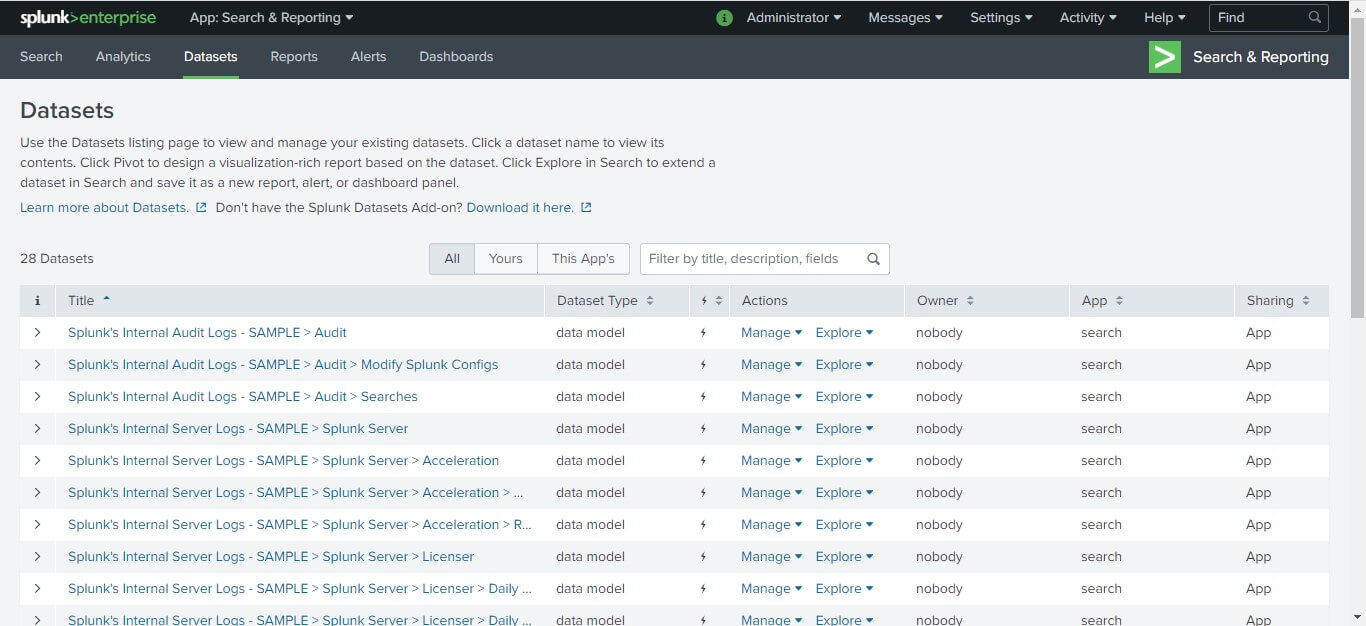
NOTE
|
 For Videos Join Our Youtube Channel: Join Now
Feedback
- Send your Feedback to [email protected]
Help Others, Please Share


