| |

Output of Independent Sample T-testIn this section, we will discuss the Output of the Independent sample t-test. The output of Independent sample t-test is given below, which is the output of the previous Define Input option file: 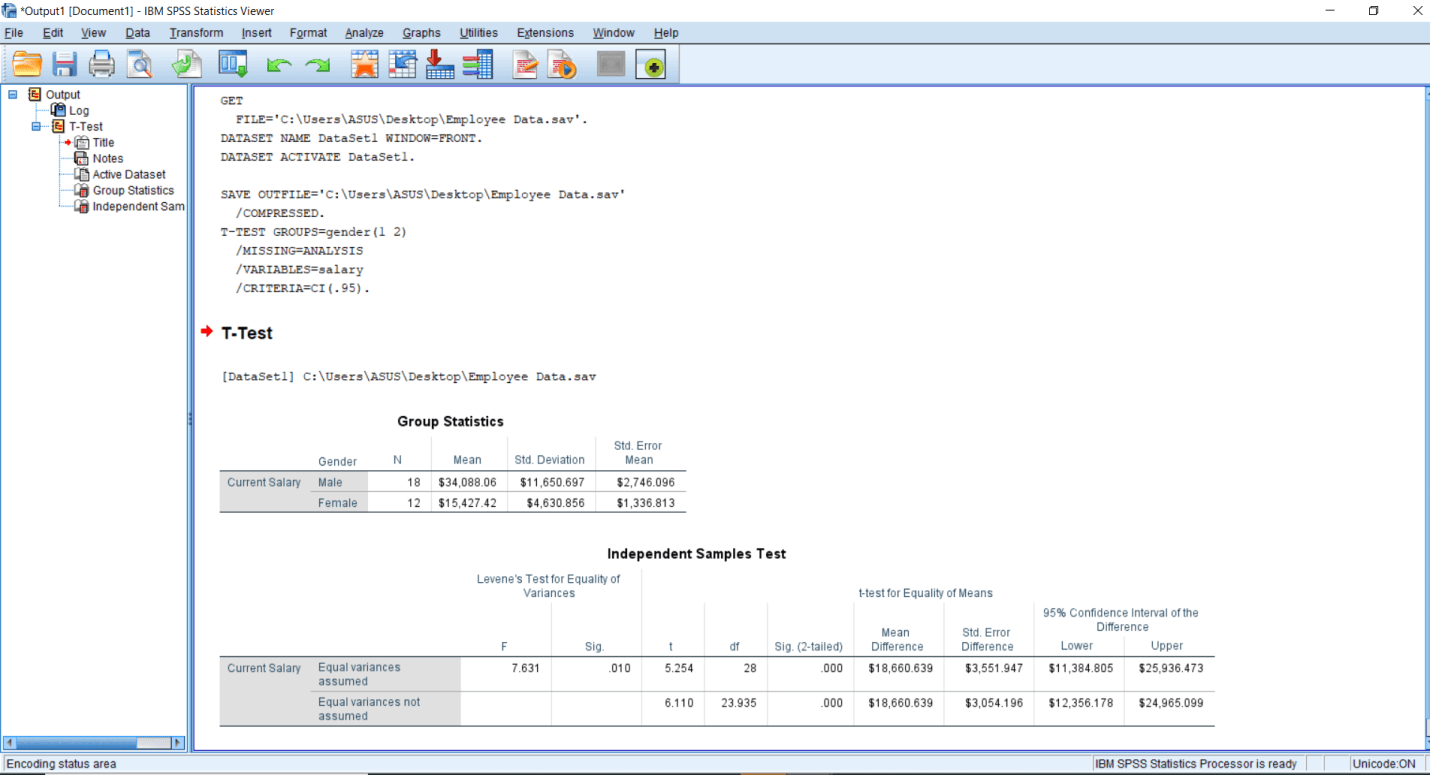
The first table is a descriptive table. So, it gives the average salary, no of people along with means, Standard deviation, Standard Error mean. We have two groups 1 and 2. Current salary is our dependent variable, and Gender is our Independent variable. We have 18 males and 12 females. 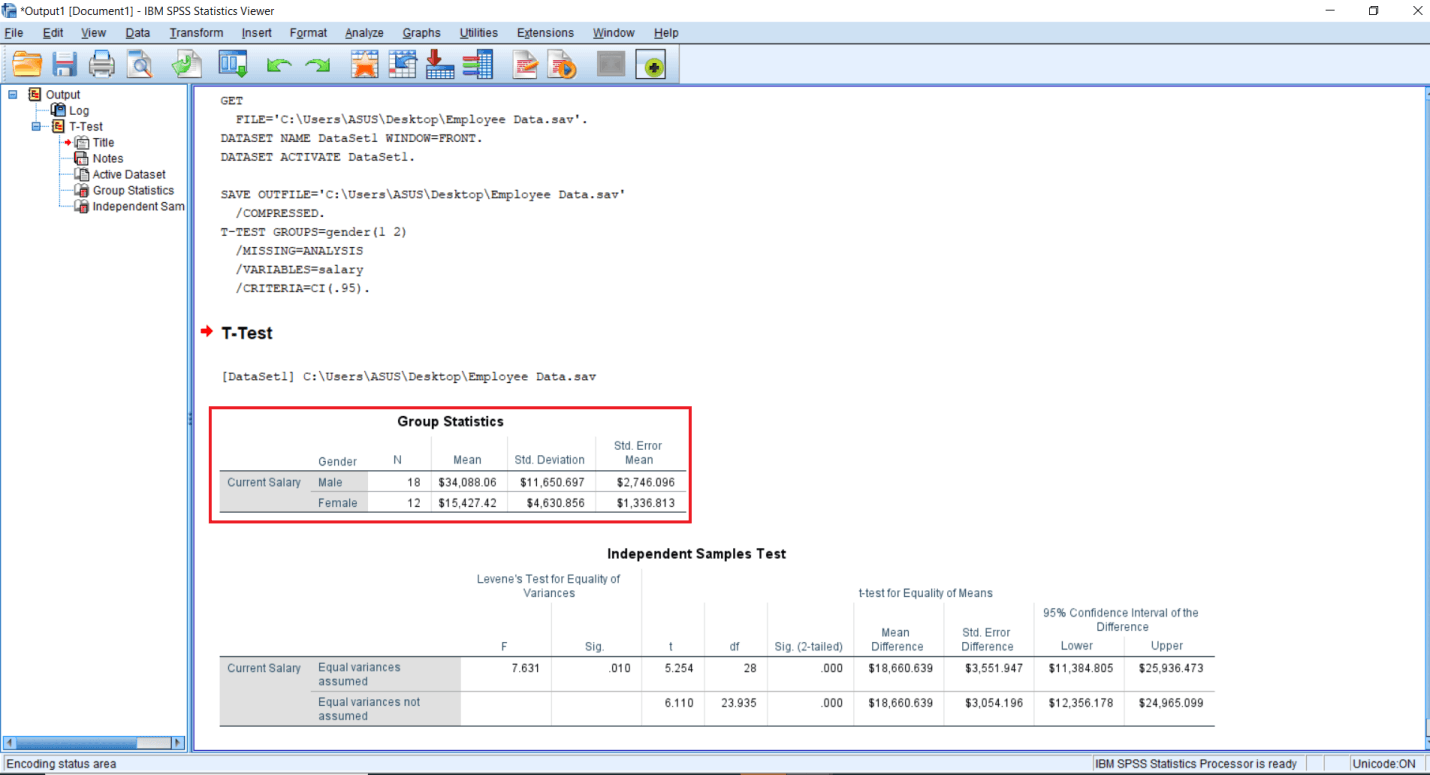
The average salary drawn by males is 34 thousand 008.06 dollars huge compared to the females who are drawing on an average of 15 thousand 427.42 dollars. So even if we don't do a significance testing and just look at these Mean figures, we are getting the impression that there is a huge difference between the salary of males and females. So we are expecting a significant effect of Gender on salary. 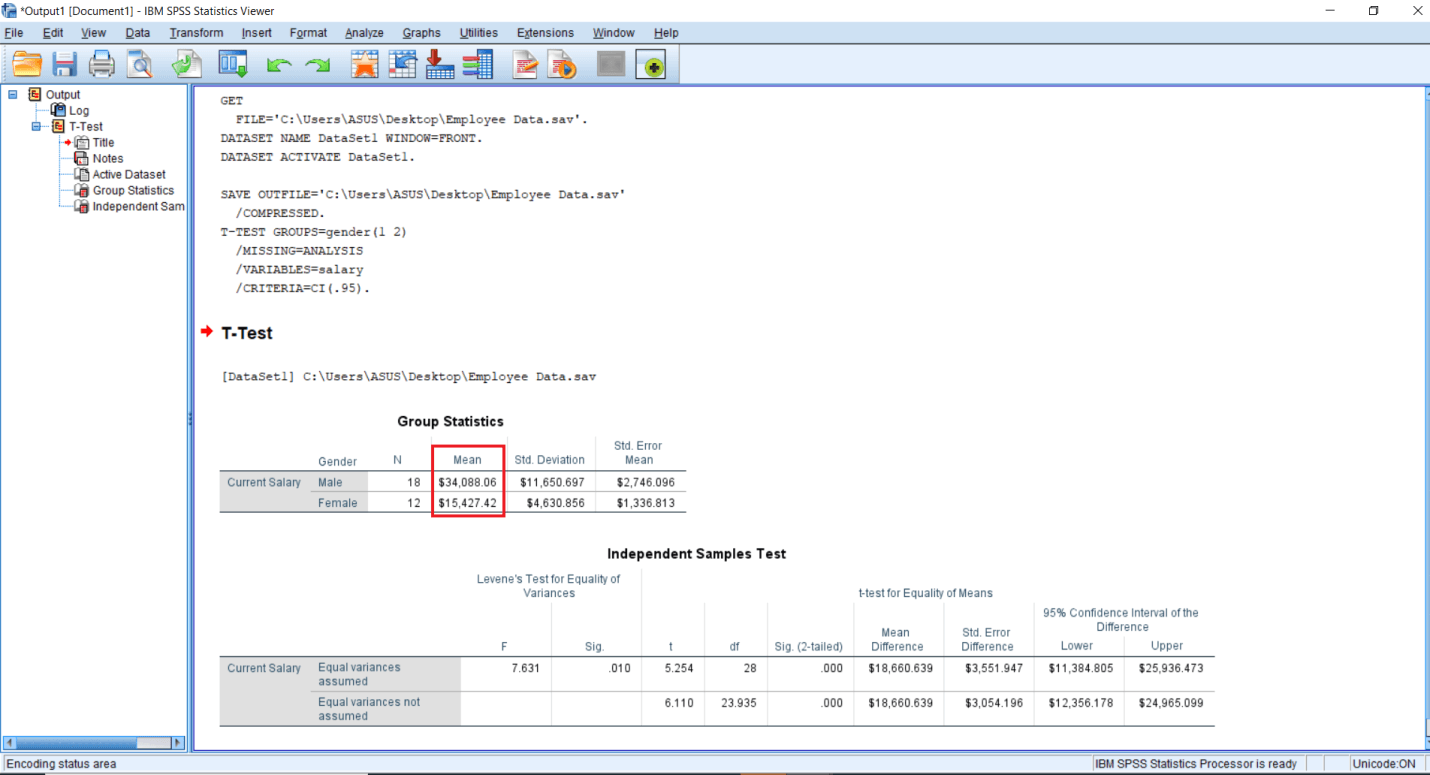
Then we have a Standard Deviation for these two groups. The males are drawing the higher salary again, but the variance of salary is quite high in the male group compared to the female group, in fact, more than twice. 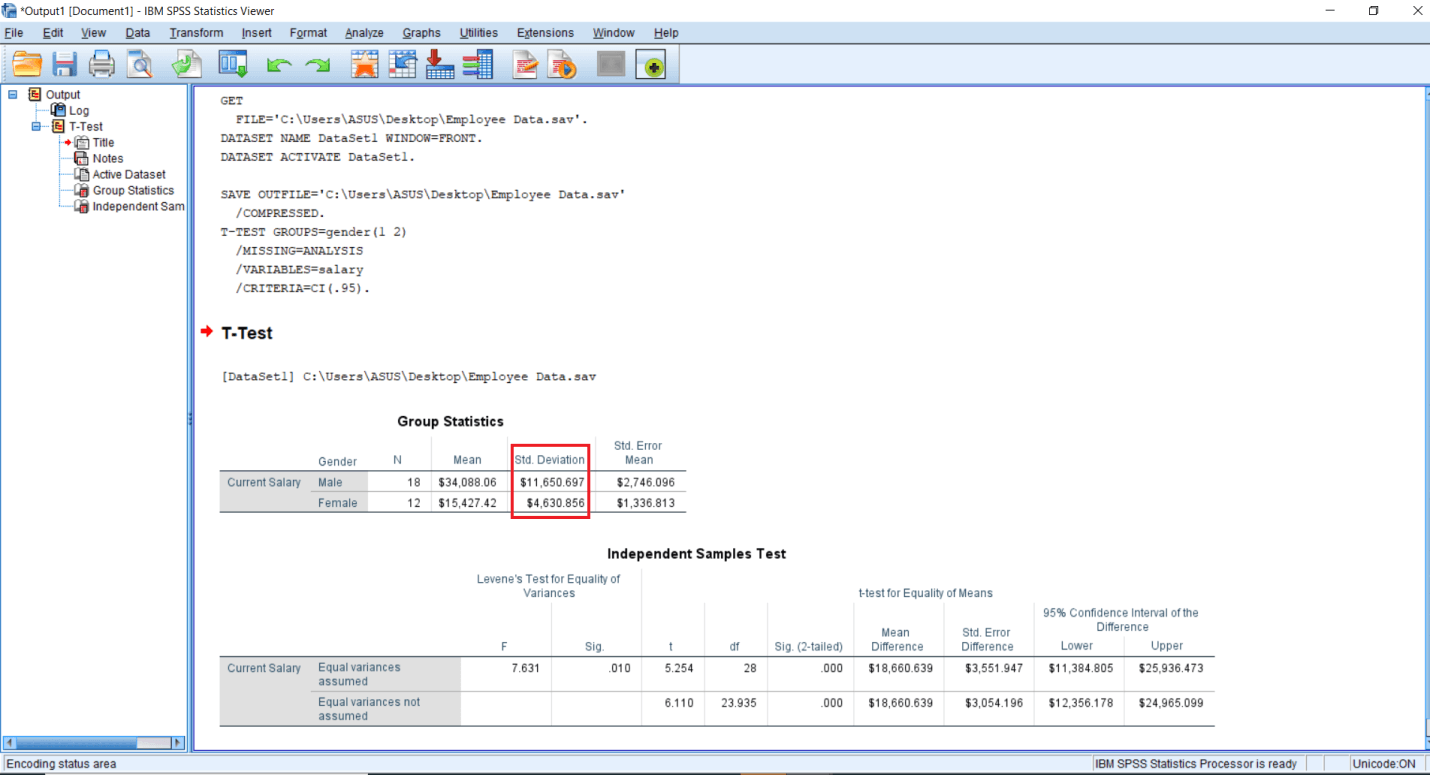
The Independent sample t-test is an inferential test, and it is based on the sample characteristics. We are trying to draw inferences for the population. So Standard Error of Mean basically the first two standard deviations of various sample means that we draw from the population. Now imagine a situation where we are doing the study, and we are drawing a lot of subsamples from the population. We draw one sample like suppose we are having 10000 people in the employee category, and out of those 10000, we randomly draw a 100 sample. Now, this 100 will be having a mean salary and some standard deviation. Again we draw another 100 samples that will be having another mean and standard deviation. Similarly, we keep on drawing the samples from the population, and we are going to get different means for different samples. If there is a more variation in these samples that we are drawing, it means we are committing more amount of Error in the estimation of a population mean. So that's why we have a figure called Standard error of Mean. So that basically tells us the average amount of error when we draw n number of samples from the population. So our Standard error of mean is quite less than the average salary, but it's a bit high for the male group compared to the female group. Similarly, Standard Deviation is again high for males groups as compared to the female groups. It might be due to outliers since we did not eliminate the outliers, but it will come down if we eliminate the outliers. 
All in all, we will keep in mind that our Standard deviation should not be more than our Mean. Similarly, our Standard error should not be more either Standard Deviation or Mean. So this is the interpretation for the Descriptive statistics. Generally, we are not supposed to report the entire thing, but only for the sake of understanding, we can know it.
Next TopicPaired Sample T-test
|
 For Videos Join Our Youtube Channel: Join Now
Feedback
- Send your Feedback to [email protected]
Help Others, Please Share


