| |

Supply Chain Analysis using PythonThe network of manufacturing and distribution involved in creating and delivering commodities to clients is known as the supply chain. And supply chain analysis investigates many supply chain elements to learn ways to boost its efficiency and add more value for consumers. This post is for you if you want to understand how to analyze the supply chain. This tutorial will walk you through the Python supply chain analysis assignment. Supply Chain Analysis: DatasetInformation on the many supply chain phases, such as sourcing, item, transportation, inventory management, sale, and customer demographics, is necessary to analyze a company's supply chain. We discovered the perfect information for this challenge, which contains information about a Trend and Beauty startup's supply chain. Supply chain analytics is an important component of information-driven decision-making in various sectors, including manufacturing, retailing, health, and logistics. It is the procedure of gathering, examining, and extrapolating information on the flow of services and items from suppliers to clients. This information was obtained from a startup in the fashion and beauty industries. The information set relies on the makeup item supply chain. All the characteristics in the information set are listed below:
You must do a supply chain analysis to identify information-driven strategies to increase customer satisfaction and supply chain performance while lowering costs and maximizing revenues for all parties involved. Main table:
In the following section, We'll walk you through performing a supply chain analysis with the Python programming language. Supply Chain Analysis using PythonLet's begin the supply chain analysis work by importing the information and the required Python libraries: Reading the DataSource Code Snippet Output: Item type SKU Cost Assumption Number of items sold \ 0 hair SKU_0 52.303005 55 302 1 skin SKU_1 14.343523 25 435 2 hair SKU_2 11.312533 34 3 3 skin SKU_3 51.153343 53 33 4 skin SKU_4 4.305425 25 341 Revenue generated Customer demographics Stock levels Lead times \ 0 3551.225422 Binary 53 4 1 4450.200055 Male 53 30 2 2544.442525 Unknown 1 10 3 4455.335425 Binary 23 13 4 2535.505152 Binary 5 3 Order quantities ... Location Lead time Itemion volumes \ 0 25 ... Mumbai 22 215 1 34 ... Mumbai 23 514 2 33 ... Mumbai 12 241 3 52 ... Kolkata 24 234 4 55 ... Delhi 5 414 Manufacturing lead time Manufacturing costs Inspection outcomes \ 0 22 45.242342 Pending 1 30 33.515452 Pending 2 24 30.533012 Pending 3 13 35.524441 Fail 4 3 22.055151 Fail Defect rates Transportation modes Routes Costs 0 0.225410 Road Route B 134.452045 1 4.354053 Road Route B 503.055542 2 4.530523 Air Route C 141.220232 3 4.445542 Rail Route A 254.445152 4 3.145530 Air Route A 223.440532 [5 rows x 24 columns] Let's look at the informationset's descriptive statistics: Source Code Snippet Output:
            Cost  Assumption  Number of items sold  Revenue generated  \
count  100.000000    100.000000               100.000000         100.000000
mean    42.452451     43.400000               450.220000        5445.043134
std     31.153123     30.443314               303.430044        2432.341444
min      1.522245      1.000000                 3.000000        1051.513523
25%     12.524323     22.450000               134.250000        2312.344151
50%     51.232331     43.500000               322.500000        5005.352023
45%     44.123223     45.000000               404.250000        3253.245221
max     22.141322    100.000000               225.000000        2355.455453

       Stock levels  Lead times  Order quantities  Ship times  \
count    100.000000  100.000000        100.000000      100.000000
mean      44.440000   15.250000         42.220000        5.450000
std       31.352342    3.435301         25.434422        2.424233
min        0.000000    1.000000          1.000000        1.000000
25%       15.450000    3.000000         25.000000        3.450000
50%       44.500000   14.000000         52.000000        5.000000
45%       43.000000   24.000000         41.250000        3.000000
max      100.000000   30.000000         25.000000       10.000000

       Ship costs   Lead time  Itemion volumes  \
count      100.000000  100.000000          100.000000
mean         5.543142   14.030000          554.340000
std          2.551345    3.345251          253.045351
min          1.013434    1.000000          104.000000
25%          3.540243   10.000000          352.000000
50%          5.320534   13.000000          553.500000
45%          4.501525   25.000000          424.000000
max          2.222315   30.000000          235.000000

       Manufacturing lead time  Manufacturing costs  Defect rates       Costs
count                100.00000           100.000000    100.000000  100.000000
mean                  14.44000            44.255523      2.244153  522.245432
std                    3.21243            23.232341      1.451355  253.301525
min                    1.00000             1.035052      0.013503  103.215243
25%                    4.00000            22.233222      1.002550  313.443455
50%                   14.00000            45.205522      2.141353  520.430444
45%                   23.00000            53.521025      3.553225  453.043231
max                   30.00000            22.455102      4.232255  224.413450
Let's now begin the process of analysing the Supply Chain by examining the connection between the cost of the items and the income they produce: Source Code Snippet Output: 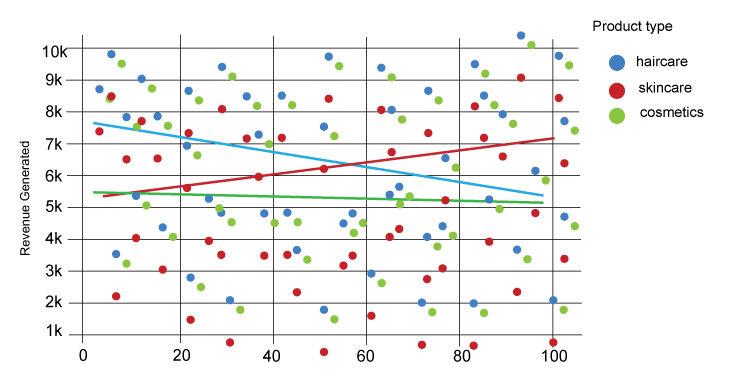
As an outcome, the corporation makes more money from skin goods, and the more money they make, the more expensive the skin items are. Let's now examine the sale by item category: Source Code Snippet Output: 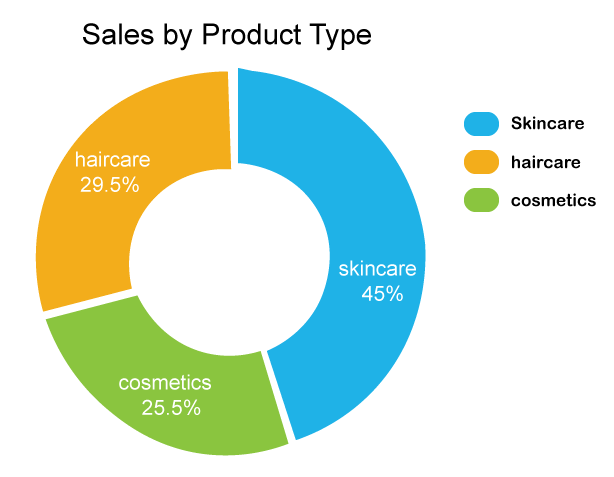
Therefore, skin goods account for 45% of the market, followed by hair items (22.5%) and cosmetics (25.5%). Let's now examine the entire income made by Ship carriers: Source Code Snippet Output: 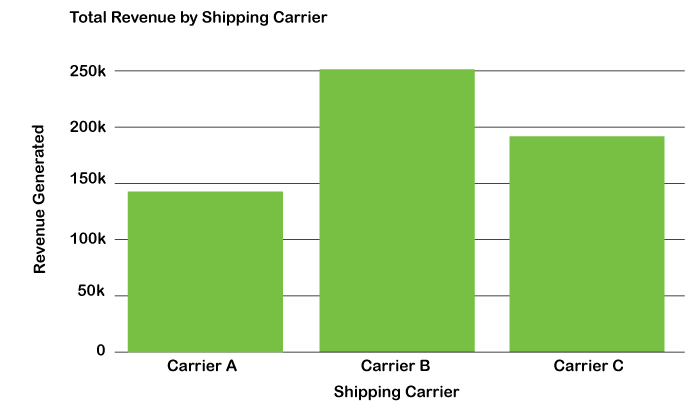
As an outcome, the corporation uses three carriers for transport, and Carrier B aids in increasing income. Let's now examine the typical lead time and typical item expenses for all of the company's items: Source Code Snippet Output: Item type Average Lead Time Average Manufacturing Costs 0 cosmetics 13.533452 43.052440 One hair 13.405332 43.454223 Two skin 13.000000 43.223154 Analysing SKUsThe information set includes a column for SKU_s. It must have been the first time you heard it. Stock Keeping Units is what SKU stands for. They function as unique codes that assist businesses in keeping track of all the various items they have for sale. Imagine you own a sizable toy shop filled with a variety of toys. Each toy is unique and has a name and a cost, but you need the means to identify them when you want to know how many you still have. As an outcome, you assign each toy a special code, similar to a codeword only the shop knows. SKU is the name of this code. You now understand what an SKU is. Let's examine the income each SKU earned now: Source Code Snippet Output: 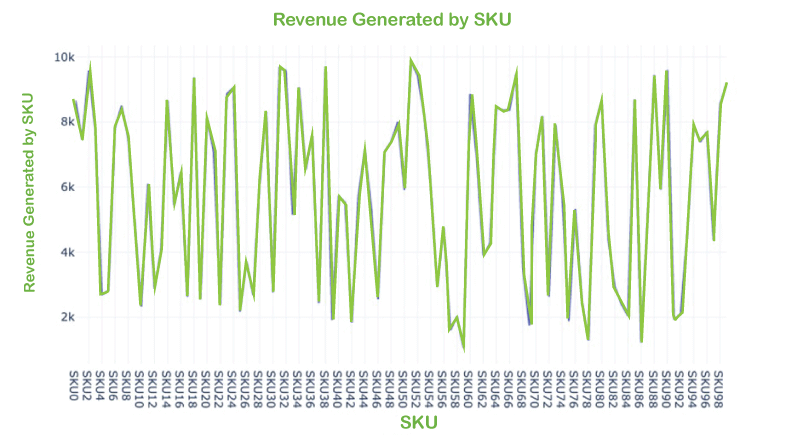
The information set also includes a column called Stock levels. Stock levels describe the number of goods a shop or company has. Let's now examine the stock levels for each SKU_: Source Code Snippet Output: 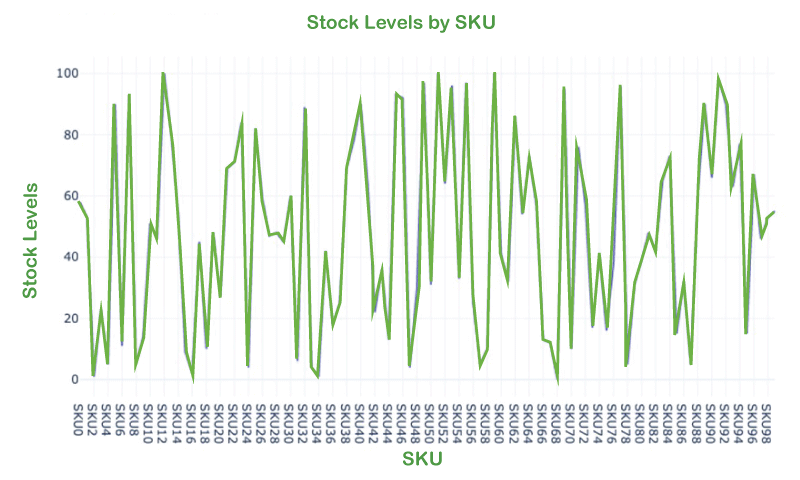
Let's look at the order quantity for each SKU right now: Source Code Snippet Output: 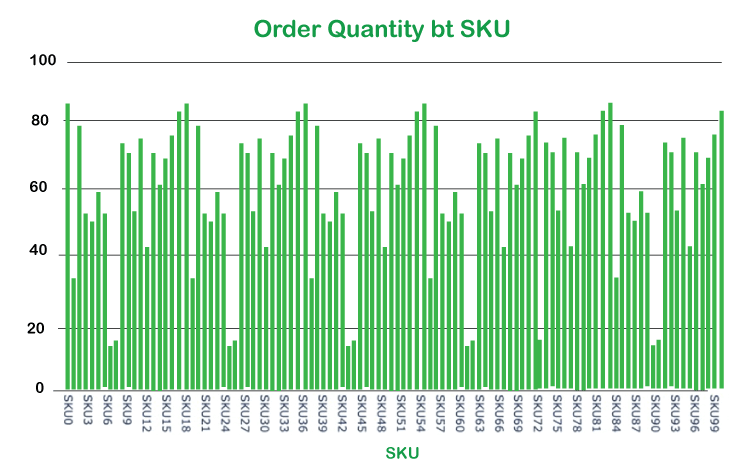
Cost AnalysisLet's now examine the carriers' shipment costs: Source Code Snippet Output: 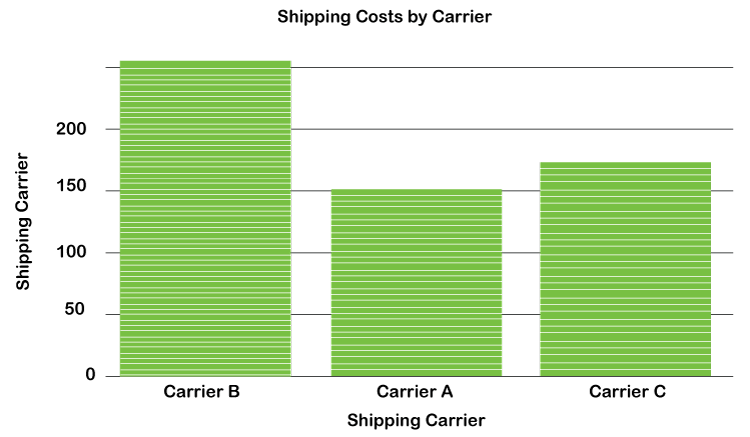
One of the visualizations, as mentioned above, showed how Carrier B helps the business generate more income. Additionally, among the three carriers, it is the most expensive. Let's now examine the cost distribution by the method of transportation: Source Code Snippet Output: 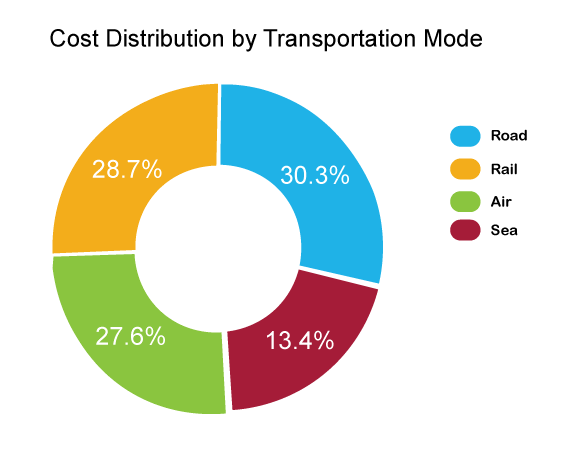
To deliver goods, the corporation spends more on the road and rail forms of transportation. Defect Rate ExaminationThe percentage of goods that are found to be flawed or damaged after delivery is referred to as the supply chain defect rate. Let's examine the overall average failure rate for all item categories: Source Code Snippet Output: 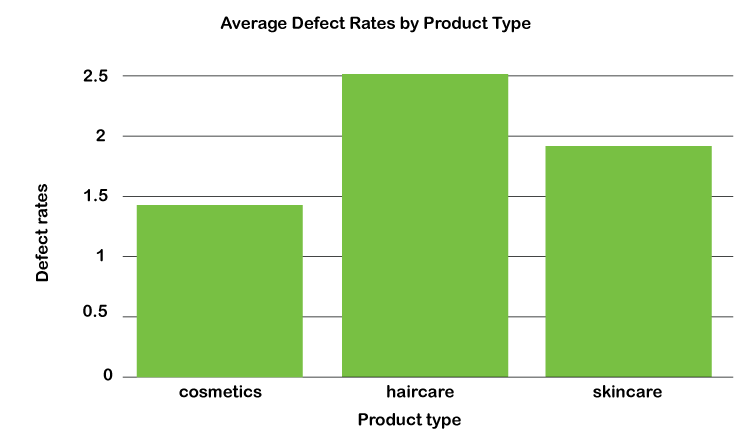
Therefore, there are more defects in hair items. Check out the defect rates by the method of transportation now: Source Code Snippet Consolidated Code for Supply Chain using PythonOutput: 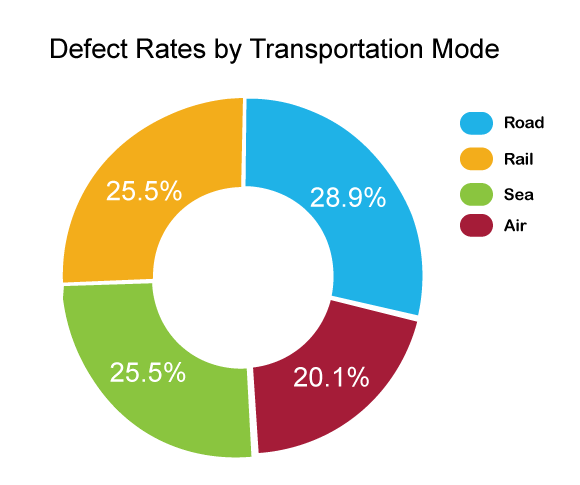
Air transportation has the lowest failure rate, whereas road transportation has a higher defect rate. So this is how you would use the Python computer language to analyze a company's supply chain. SummarySupply Chain Analysis dissects different aspects of a supply chain to determine ways to increase its efficiency and add more value for consumers. I hope you enjoyed reading this Python-based supply chain analysis paper. Please feel free to post insightful inquiries in the comments area below. |
 For Videos Join Our Youtube Channel: Join Now
Feedback
- Send your Feedback to [email protected]
Help Others, Please Share


