| |

Tableau Tree MapsThe treemap displays the data in nested rectangles. The dimensions define the structure of the treemap and measures determine the color or size of the individual square. The squares are easy to visualize as the size and shade of the color of the square reflects the value of the measure. A Treemap is created using one or more dimension with one or two measures. For example, consider the data source such as Sample-Superstore, if you want to find the size of Profits for each ShipMode values. Below are the following steps to create a treemap. Step 1: Drag the measures Profit and drop into the color shelf under Marks pane. Step 2: Again, drag the measures Profit and drop into the Size shelf. 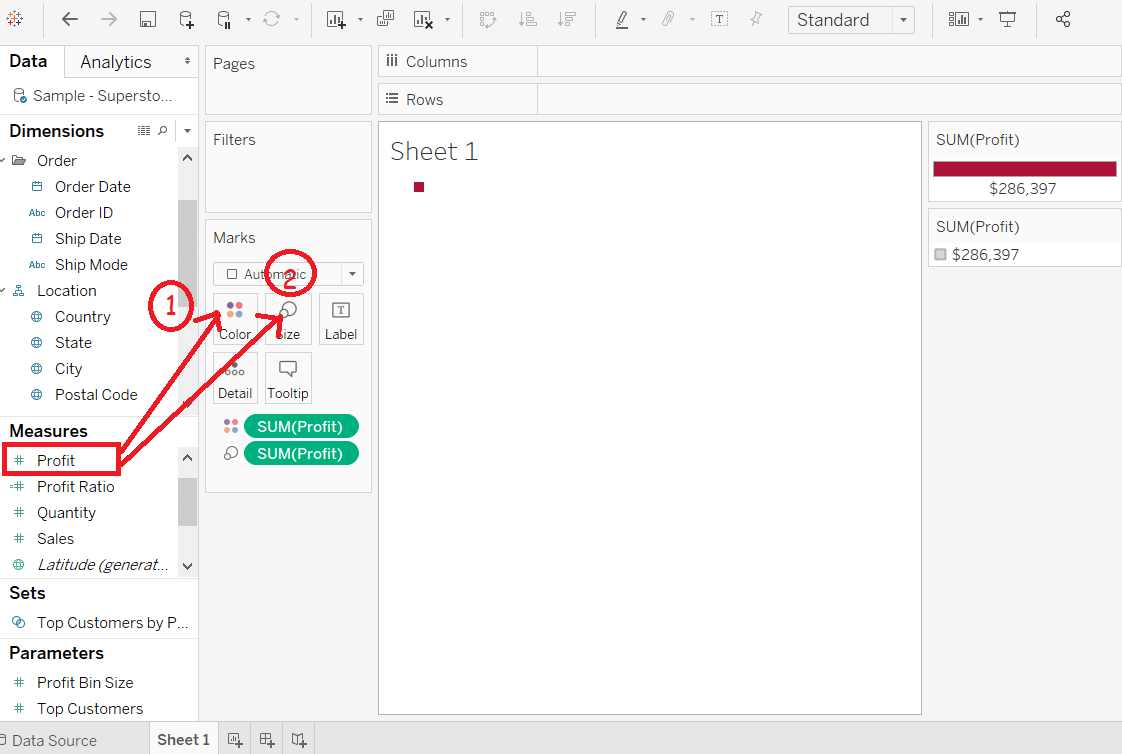
Step 3: Drag the dimension Ship Mode and drop into the Label shelf. 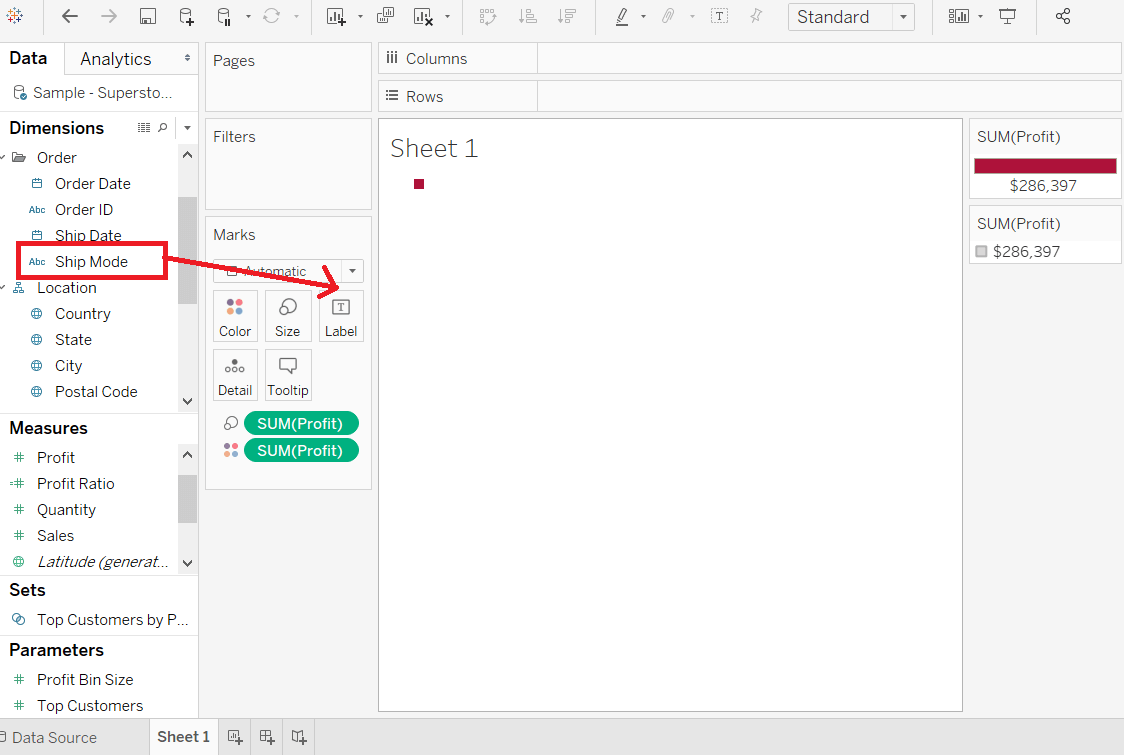
Step 4: Choose the treemap option from the "show me". 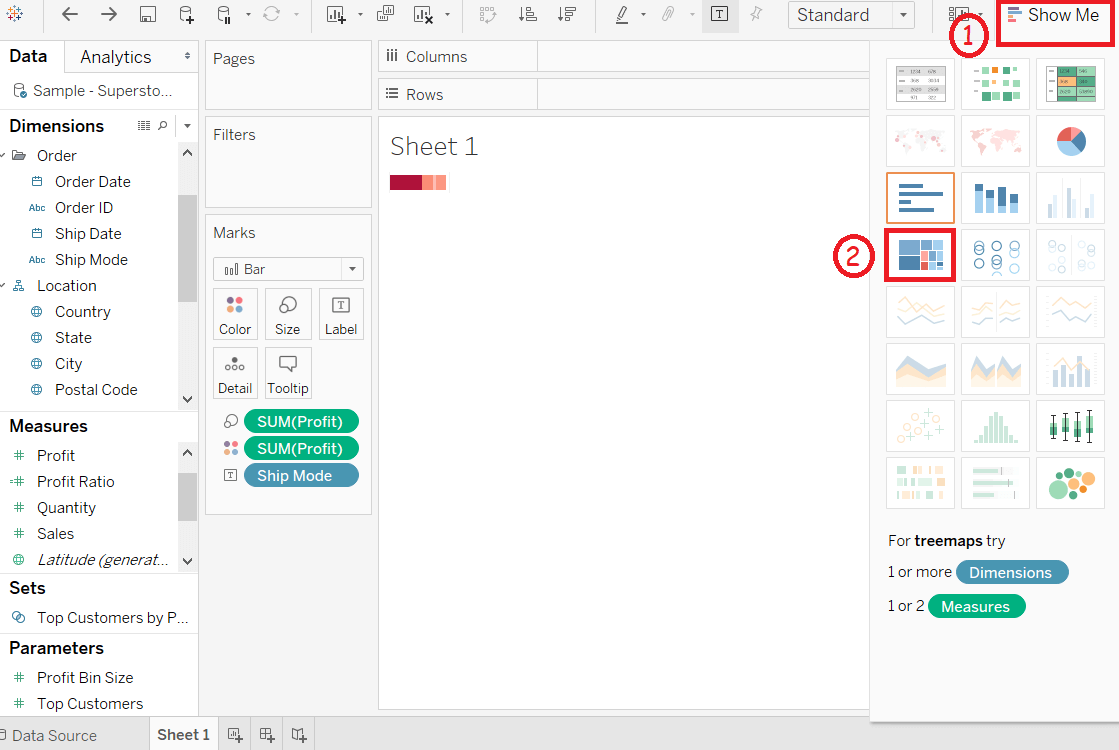
After completing all the above steps, it creates the treemap shown in the below screenshot. 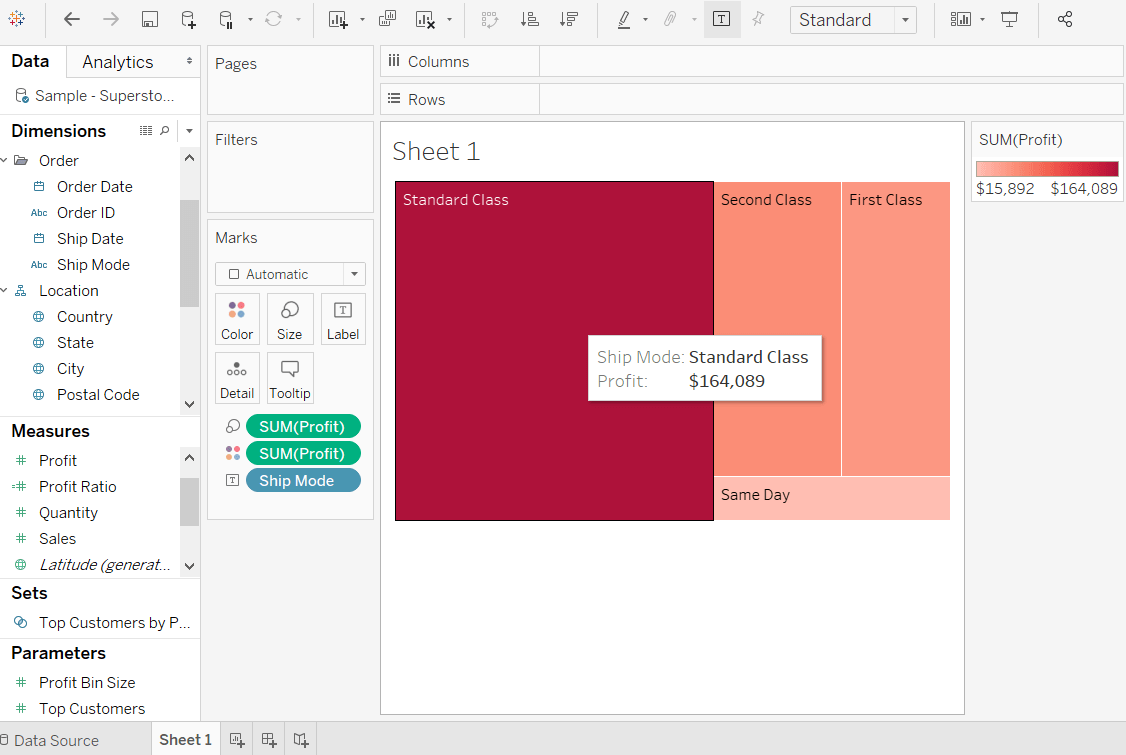
Next TopicTableau Scatter Plot
|
 For Videos Join Our Youtube Channel: Join Now
Feedback
- Send your Feedback to [email protected]
Help Others, Please Share


